This video provides background information and teaching tips about the history and …
This video provides background information and teaching tips about the history and relevance of phenology and seasonal observations of plants and animals within the context of rural Wisconsin.
This video discusses the differences between climate and weather by defining and …
This video discusses the differences between climate and weather by defining and presenting examples of each. When presenting examples of weather, the video focuses on severe events and how meteorologists predict and study the weather using measurement, satellites, and radar. The climate focus is primarily on an overview of climate zones.
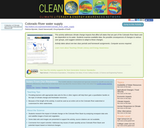
This activity addresses climate change impacts that affect all states that are …
This activity addresses climate change impacts that affect all states that are part of the Colorado River Basin and are dependent on its water. Students examine available data, the possible consequences of changes to various user groups, and suggest solutions to adapt to these changes.
In this activity, students collect data and analyze the cost of using …
In this activity, students collect data and analyze the cost of using energy in their homes and investigate one method (switching to compact fluorescent light bulbs) of reducing energy use. This activity provides educators and students with the means to connect 'energy use consequences' and 'climate change causes.' Through examining home energy use and calculating both pollution caused by the generation of electricity and potential savings, students can internalize these issues and share information with their families.
This well designed experiment comparing CO2 impacts on salt water and fresh …
This well designed experiment comparing CO2 impacts on salt water and fresh water. In a short demonstration students examine how distilled water (i.e., pure water without any dissolved ions or compounds) and seawater are affected differently by increasing carbon dioxide in the air.
This Earth Exploration Toolbook chapter is a detailed computer-based exploration in which …
This Earth Exploration Toolbook chapter is a detailed computer-based exploration in which students learn how various climatic conditions impact the formations of sediment layers on the ocean floor. They analyze sediment core data from the Ross Ice Shelf in Antarctica for evidence of climate changes over time. In addition, they interact with various tools and animations throughout the activity, in particular the Paleontological Stratigraphic Interval Construction and Analysis Tool (PSICAT) that is used to construct a climate change model of a sediment core from core images.
This teaching activity addresses environmental stresses on corals. Students assess coral bleaching …
This teaching activity addresses environmental stresses on corals. Students assess coral bleaching using water temperature data from the NOAA National Data Buoy Center. Students learn about the habitat of corals, the stresses on coral populations, and the impact of increased sea surface temperatures on coral reefs. In a discussion section, the connection between coral bleaching and global warming is drawn.
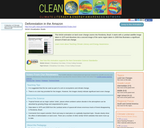
This NASA animation on land cover change zooms into Rondonia, Brazil. It …
This NASA animation on land cover change zooms into Rondonia, Brazil. It starts with a Landsat satellite image taken in 1975 and dissolves into a second image of the same region taken in 2009 indicating that there has been a significant amount of land use change.
Students are introduced to tree rings by examining a cross section of …
Students are introduced to tree rings by examining a cross section of a tree, also known as a 'tree cookie.' They discover how tree age can be determined by studying the rings and how ring thickness can be used to deduce times of optimal growing conditions. Next, they investigate simulated tree rings applying the scientific method to explore how climatic conditions varied over time.
This multi-part activity introduces users to normal seasonal sea surface temperature (SST) …
This multi-part activity introduces users to normal seasonal sea surface temperature (SST) variation as well as extreme variation, as in the case of El Nino and La Nina events, in the equatorial Pacific Ocean. Via a THREDDS server, users learn how to download seasonal SST data for the years 1982 to 1998. Using a geographic information system (GIS), they visualize and analyze that data, looking for the tell-tale SST signature of El Nino and La Nina events that occurred during that time period. At the end, students analyze a season of their own choosing to determine if an El Nino or La Nina SST pattern emerged in that year's data.
In this activity from the National Center for Atmospheric Research (NCAR), students …
In this activity from the National Center for Atmospheric Research (NCAR), students collect weather data over several days or weeks, graph temperature data, and compare the temperature data collected with long-term climate averages from where they live. Understanding the difference between weather and climate and interpreting local weather data are important first steps to understanding larger-scale global climate changes.
This activity illustrates the carbon cycle using an age-appropriate hook, and it …
This activity illustrates the carbon cycle using an age-appropriate hook, and it includes thorough discussion and hands-on experimentation. Students learn about the geological (ancient) carbon cycle; they investigate the role of dinosaurs in the carbon cycle, and the eventual storage of carbon in the form of chalk. Students discover how the carbon cycle has been occurring for millions of years and is necessary for life on Earth. Finally, they may extend their knowledge to the concept of global warming and how engineers are working to understand the carbon cycle and reduce harmful carbon dioxide emissions.
In this video from Young Voices for the Planet, four middle-school girls …
In this video from Young Voices for the Planet, four middle-school girls (The Green Team) talk about their efforts to work with their peers to reduce the carbon footprint of their school and how they made the school more energy efficient.
This video from NASA presents scientific evidence that demonstrates that different regions …
This video from NASA presents scientific evidence that demonstrates that different regions on Earth do not respond equally to increased temperatures. Ice-covered regions appear to be particularly sensitive to even small changes in global temperature. Background essay and discussion questions are also included.
This short video uses animated imagery from satellite remote sensing systems to …
This short video uses animated imagery from satellite remote sensing systems to illustrate that Earth is a complex, evolving body characterized by ceaseless change. Adapted from NASA, this visualization helps explain why Earth is an integrated system of components and processes.
This interactive visualization adapted from NASA and the U.S. Geological Survey illustrates …
This interactive visualization adapted from NASA and the U.S. Geological Survey illustrates the concept of albedo, which is the measure of how much Solar Radiation is reflected from Earth's surface.
Students perform a lab to explore how the color of materials at …
Students perform a lab to explore how the color of materials at the Earth's surface affect the amount of warming. Topics covered include developing a hypothesis, collecting data, and making interpretations to explain why dark colored materials become hotter.
Hands-on laboratory activity that allows students to investigate the effects of distance …
Hands-on laboratory activity that allows students to investigate the effects of distance and angle on the input of Solar Radiation at Earth's surface, the role played by albedo, the heat capacity of land and water, and how these cause the seasons. Students predict radiative heating based on simple geometry and experiment to test their hypotheses.
This video focuses on the conifer forest in Alaska to explore the …
This video focuses on the conifer forest in Alaska to explore the carbon cycle and how the forest responds to rising atmospheric carbon dioxide. Topics addressed in the video include wildfires, reflectivity, and the role of permafrost in the global carbon cycle.
No restrictions on your remixing, redistributing, or making derivative works. Give credit to the author, as required.
Your remixing, redistributing, or making derivatives works comes with some restrictions, including how it is shared.
Your redistributing comes with some restrictions. Do not remix or make derivative works.
Most restrictive license type. Prohibits most uses, sharing, and any changes.
Copyrighted materials, available under Fair Use and the TEACH Act for US-based educators, or other custom arrangements. Go to the resource provider to see their individual restrictions.