This lesson uses an experiment with paper airplanes to provide data to practice finding percent of change.
- Subject:
- Computation and Estimation
- Mathematics
- Material Type:
- Activity/Lab
- Assessment
- Date Added:
- 12/20/2019

This lesson uses an experiment with paper airplanes to provide data to practice finding percent of change.
This lesson has students complete a basketball activity and then use the data from the activity to create a scatterplot. Once they create their scatterplot they determine correlation and draw a line of best fit.
Students use a block of clay, a spring scale, and a glass of liquid of unknown volume to determine the density of the liquid in the cup.

This module focuses on SOL 5.7c, energy’s effects on phases of matter. The target population is a fifth grade inclusive classroom. After this learning experience, students should understand that as its temperature increases, many kinds of matter change from a solid to a liquid to a gas. As its temperature decreases, that matter changes from a gas to a liquid to a solid. This module was developed by Karin Kaerwer, Stephanie Hooks, Sarah Donnelly as part of a Virginia Commonwealth University STEM initiative sponsored by the Virginia Department of Education.
This activity is designed to be a self-paced activity to review students on the parts of Experimental Design while at home or in the classroom. There is a simple experiment for the students to complete to generate and collect data and a second example in which they design their own experiment and collect data. They are then led through the process of analyzing their data and writing a conclusion.

Learn about the five senses. Mary and Mike are out and about, using their five senses to explore a city park. Mary collects leaves and watches the squirrels busily gathering acorns, while Mike eats snacks from his bag. Back in the studio, they find new ways to make music and even try some improvisation. Special guest, Ms. McCollough, shows us how to make our very own fizzy volcanoes. How will you be brave and curious today?
Here is a simple lab report that can be used in any science class (6-12). The report is designed to help students identify hypotheses, independent and dependent variables, controls, constants, and to analyze experiments. I have also included tips on a simple way to teach your students to identify the IV and DV through a "cave man hypothesis" and how to teach controls with less confusion.
This is a series of two activities that should be used to support students in understanding the difference between experimental and theoretical probability
This is a series of two activities that should be used to support students in understanding the difference between experimental and theoretical probability
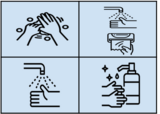
Co-authored with Kaitlin Read and Udaya DatlaCan you remember a time you've been sick? Why aren't you still sick? How did you get better?Join Udaya Sree Datla, a doctoral student in translational biology, medicine, and health at Virginia Tech, as she presents Infections, Germs, and Immune Cells. The accompanying lessons and resources provide students with an introduction to germs, the immune system, and the career path of an immunologist, all while emphasizing the importance of handwashing and incorporating a computer science twist. The second lesson capitalizes on an opportunity to integrate computer science by introducing students to the career path of computer programming and constructing a set of step-by-step instructions (algorithms) either independently or collaboratively to sequence the steps of handwashing. These resources are part of the Advancing Computer Science Education Grant to support the implementation of Virginia's Computer Science Standards of Learning in partnership with Floyd County Public Schools with additional support from Virginia Tech's Center for Communicating Science and the Institute for Creativity, Arts, and Technology.