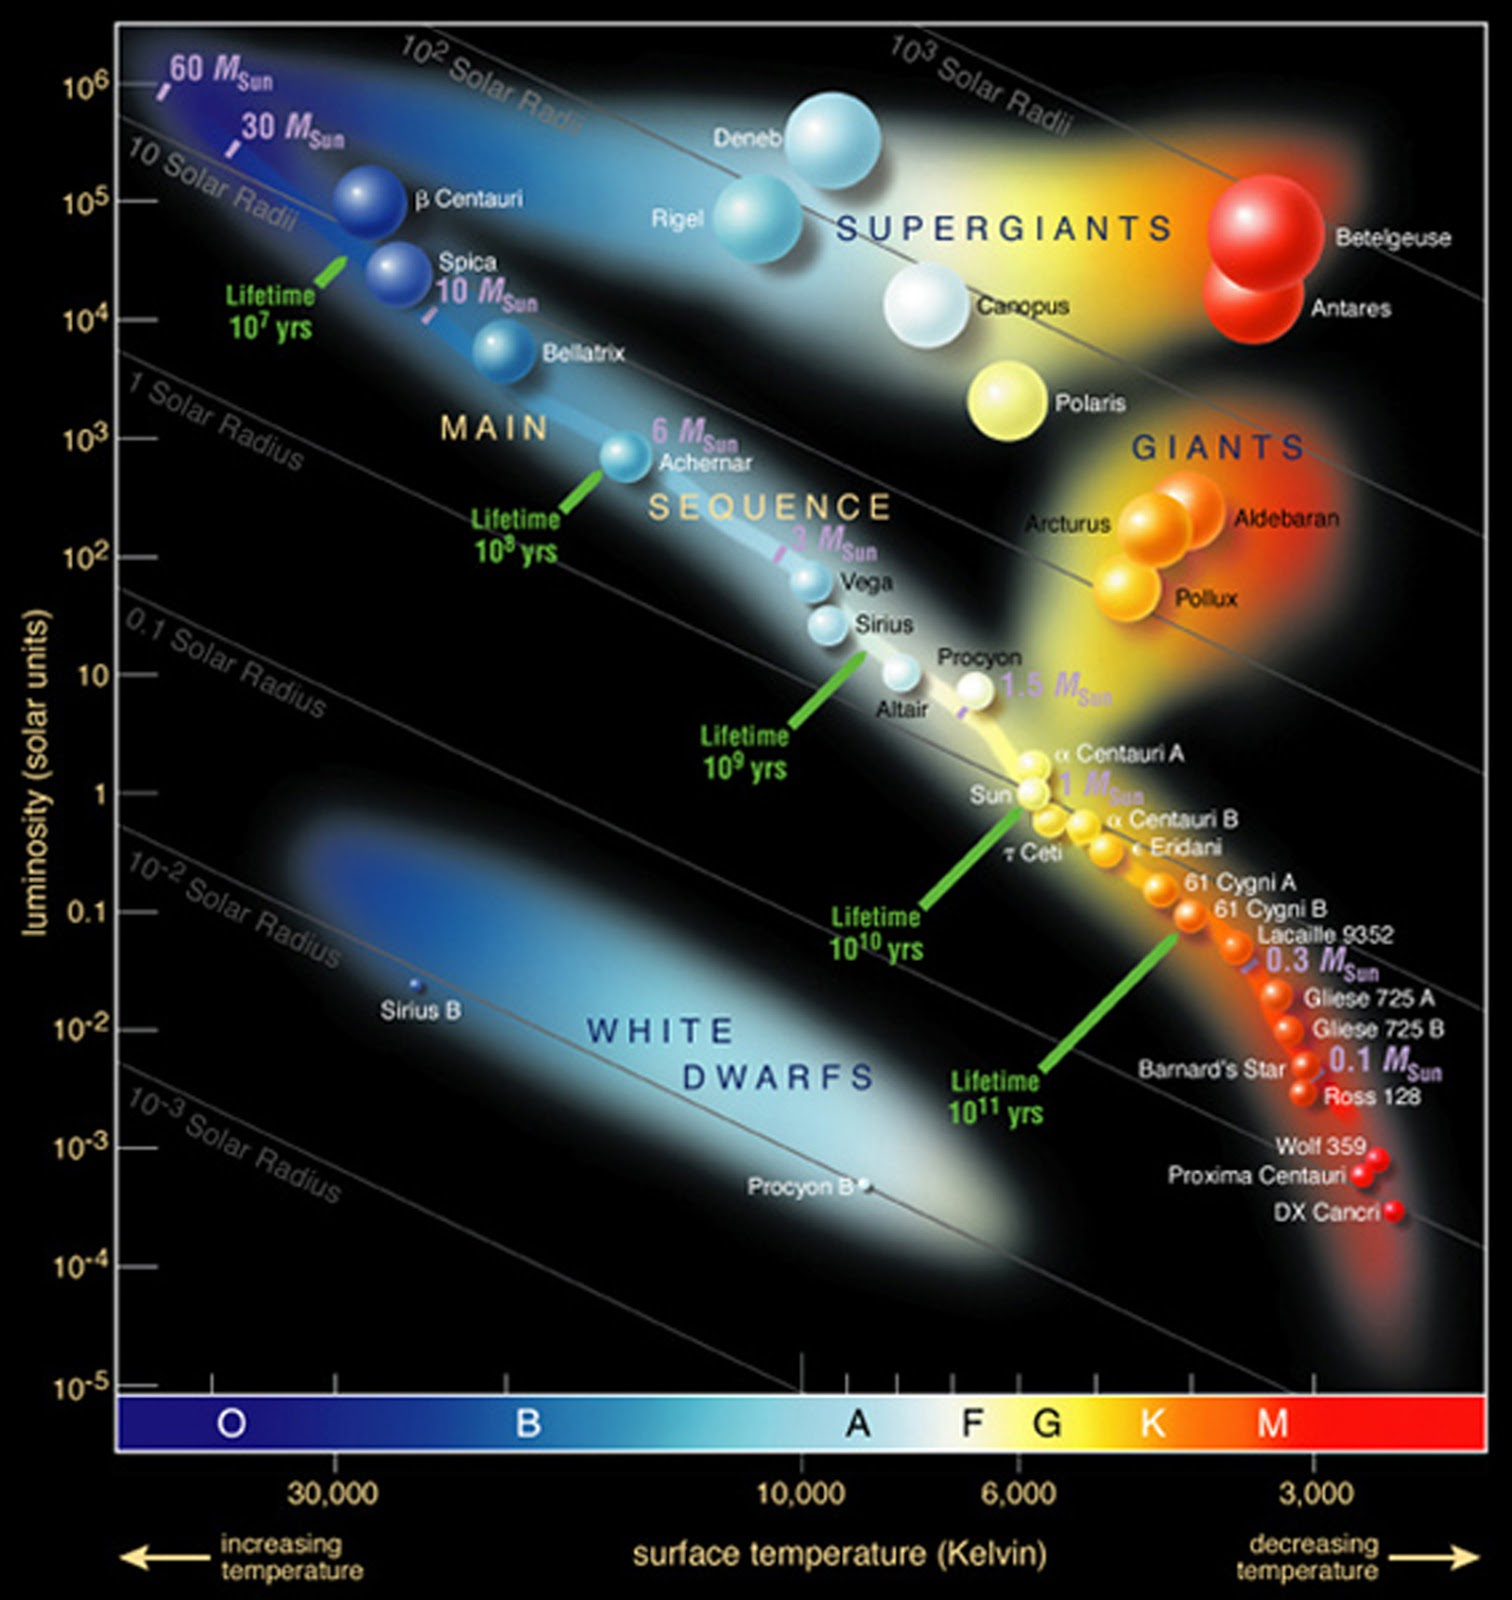
The H-R Diagram
About
In this activity, students will understand why different stars are grouped together on the H-R diagram. They will practice their graphing skills. After plotting the data, the students will make conclusions about why the stars are categorized the way that they are. The students will also be able to interpret the H-R diagram and infer relationships between a star's temperature, color, size, and age.
Learning Goals and SOL
- ES. 13: Using the Hertzsprung-Russell diagram, students will classify stars as to their place on the main sequence or in beginning or end points in their life cycles.
- Students will understand how temperature, color, size, and age effect a star's location on the H-R digram
- Students will practice graphing and analysis skills by plotting stars on the diagram and interpreting the diagram to draw inferences about stellar evolution.
Context for Use
This activity will take 50-70 minutes. Prior to the activity, the students will need to know what the H-R diagram is and understanding of stellar evolution.
Description and Teaching Materials
Stellar Data this is the data that the students will be plotting on the blank H-R diagram.
Student Activity Questions are to be completed after the students have complete this lab.
H-R Diagram Picture can be used to help answer the activity questions.

The H-R diagram
Teaching Notes and Tips
Emphasize to students the need to be careful and methodical with their graphing. Students with sloppy graphing will have poor results. This is a great activity to have students practice converting decimals to scientific notation.
The H-R Diagram Activity Questions were designed to be an additional resource to help with student comprehension. I developed these questions to better assist students with practicing their graph reading skills and their understanding of what the H-R Diagram truly represents.
Assessment
This activity is used for both graphing practice and comprehension check. Students will be able to read and understand the H-R Diagram and will be able to recognize where in the life cycle of star development a star is based in on the location.
Attributions for Remix
"How to use the HR diagram" by David W. Kobilka is licensed under Creative Commons Attribution-NonCommercial-ShareAlike 3.0.
H-R Diagram Picture: By ESO - https://www.eso.org/public/images/eso0728c/, CC BY 4.0, https://commons.wikimedia.org/w/index.php?curid=19915788