This course discusses how to use algebra for a variety of everyday …
This course discusses how to use algebra for a variety of everyday tasks, such as calculate change without specifying how much money is to be spent on a purchase, analyzing relationships by graphing, and describing real-world situations in business, accounting, and science.
Investigating domain, range, intercepts, and zerosMathematics Instructional Plans (MIPs) help teachers align …
Investigating domain, range, intercepts, and zerosMathematics Instructional Plans (MIPs) help teachers align instruction with the 2016 Mathematics Standards of Learning (SOL) by providing examples of how the knowledge, skills and processes found in the SOL and curriculum framework can be presented to students in the classroom.
In this module, students reconnect with and deepen their understanding of statistics …
In this module, students reconnect with and deepen their understanding of statistics and probability concepts first introduced in Grades 6, 7, and 8. There is variability in data, and this variability often makes learning from data challenging. Students develop a set of tools for understanding and interpreting variability in data and begin to make more informed decisions from data. Students work with data distributions of various shapes, centers, and spreads. Measures of center and measures of spread are developed as ways of describing distributions. The choice of appropriate measures of center and spread is tied to distribution shape. Symmetric data distributions are summarized by the mean and mean absolute deviation, or standard deviation. The median and the interquartile range summarize data distributions that are skewed. Students calculate and interpret measures of center and spread and compare data distributions using numerical measures and visual representations. To access this resource, you will need to create a free account for the system on which it resides. The partner provides personalized features on their site such as bookmarking and highlighting which requires a user account.
In earlier grades, students defined, evaluated, and compared functions and used them …
In earlier grades, students defined, evaluated, and compared functions and used them to model relationships between quantities. In this module, students extend their study of functions to include function notation and the concepts of domain and range. They explore many examples of functions and their graphs, focusing on the contrast between linear and exponential functions. They interpret functions given graphically, numerically, symbolically, and verbally; translate between representations; and understand the limitations of various representations. To access this resource, you will need to create a free account for the system on which it resides. The partner provides personalized features on their site such as bookmarking and highlighting which requires a user account.
In Algebra I, students have been analyzing the process of solving equations …
In Algebra I, students have been analyzing the process of solving equations and developing fluency in writing, interpreting, and translating among various forms of linear equations (Module 1) and linear and exponential functions (Module 3). These experiences, combined with modeling with data (Module 2), set the stage for Module 4. Here, students continue to interpret expressions, create equations, rewrite equations and functions in different but equivalent forms, and graph and interpret functions using polynomial function-more specifically quadratic functions as well as square root and cube root functions. To access this resource, you will need to create a free account for the system on which it resides. The partner provides personalized features on their site such as bookmarking and highlighting which requires a user account.
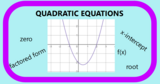
Relating the roots (zeros) of a quadratic equation and the graph of …
Relating the roots (zeros) of a quadratic equation and the graph of the equationMathematics Instructional Plans (MIPs) help teachers align instruction with the Mathematics Standards of Learning (SOL) by providing examples of how the knowledge, skills and processes found in the SOL and curriculum framework can be presented to students in the classroom.
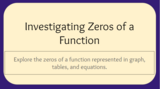
Students observe patterns between the graph, x-intercepts, factored form, roots, equation, and …
Students observe patterns between the graph, x-intercepts, factored form, roots, equation, and zeros. They use the patterns they observed and the information given in one column to fill in the other columns.
Solving multistep linear equations by finding the zeros of a related function.Mathematics …
Solving multistep linear equations by finding the zeros of a related function.Mathematics Instructional Plans (MIPs) help teachers align instruction with the Mathematics Standards of Learning (SOL) by providing examples of how the knowledge, skills and processes found in the SOL and curriculum framework can be presented to students in the classroom.
No restrictions on your remixing, redistributing, or making derivative works. Give credit to the author, as required.
Your remixing, redistributing, or making derivatives works comes with some restrictions, including how it is shared.
Your redistributing comes with some restrictions. Do not remix or make derivative works.
Most restrictive license type. Prohibits most uses, sharing, and any changes.
Copyrighted materials, available under Fair Use and the TEACH Act for US-based educators, or other custom arrangements. Go to the resource provider to see their individual restrictions.