- Number of visits 97
- Number of saves 2
- 0
Description
- Overview:
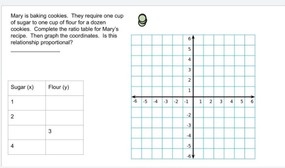
- This lesson should be used as practice after students have had experience with ratio tables, graphing points, and determining proportional relationships. On slides 1-4 students are given a situation, then they complete the ratio table, graph the coordinates, and determine if the relationship is proportional. On slides 5-7 students are given graphs and asked to determine if it represents proportional relationships, and explain why. On slide 8 students are given written situations and asked to determine if they represent proportional relationships and explain their reasoning. This lesson was created with Jamboard to provide teachers and students with real time collaboration.
- Subject:
- Mathematics
- Level:
- Middle School
- Material Type:
- Activity/Lab
- Author:
- Melody Oquinn
- Date Added:
- 04/06/2021
- License:
-
Creative Commons Attribution

- Language:
- English
- Media Format:
- Downloadable docs

Standards
Evaluations
No evaluations yet.
Comments