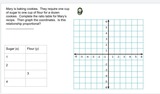
This lesson should be used as practice after students have had experience …
This lesson should be used as practice after students have had experience with ratio tables, graphing points, and determining proportional relationships. On slides 1-4 students are given a situation, then they complete the ratio table, graph the coordinates, and determine if the relationship is proportional. On slides 5-7 students are given graphs and asked to determine if it represents proportional relationships, and explain why. On slide 8 students are given written situations and asked to determine if they represent proportional relationships and explain their reasoning. This lesson was created with Jamboard to provide teachers and students with real time collaboration.
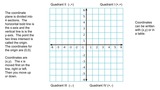
With this activity, students will review the components of the coordinate plane, …
With this activity, students will review the components of the coordinate plane, graph coordinates, and tell coordinates. This activity was created with Jamboard to allow the teacher to view students placements of points and work in real time. The activity can be presented to the whole group with the teacher giving students assignments on each slide (by sharing editor rights) or assigned to individual students with each a copy.
Student will:analyze a map of the Chesapeake Baycalculate the mean, median, mode, …
Student will:analyze a map of the Chesapeake Baycalculate the mean, median, mode, range, and numbercreate an appropriate graphinvestigate data provided by the James River and apply learning
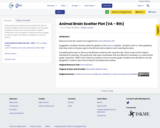
In this resources, students are provided with data of animals weight and …
In this resources, students are provided with data of animals weight and brain size. Students use the graph available on Desmos to plot the data to create a scatter plot. From the graph, students are encouraged to notice outliers and write an equation for a line of best fit.
This science and math lesson uses coated candy and water to create …
This science and math lesson uses coated candy and water to create a rainbow on a plate. It takes a popular internet activity and modifies it for the classroom. It's extended by having students hypothesize if other temperatures of water will work and if different colors of the candies run faster than others. It also meets the math SOLs because students can calculate the cost of the experiment and/or create graphs of the results of the experiments. You could extend this activity into art or English writing by having students draw their rainbows or write about what they saw happening on the plate as a report writing. You could have them take it a step further and do a creative writing about what they think is at the other end of the rainbow.
Introducing Data collection and Analysis: This activity include a data collection sheet …
Introducing Data collection and Analysis: This activity include a data collection sheet and questions to analyze the data. The activity can be done as a whole group, small group, or by individual students. Estimated time from start to finish is 30-45 minutes based on prior knowledge.
Elementary grade students investigate heat transfer in this activity to design and …
Elementary grade students investigate heat transfer in this activity to design and build a solar oven, then test its effectiveness using a temperature sensor. It blends the hands-on activity with digital graphing tools that allow kids to easily plot and share their data. Included in the package are illustrated procedures and extension activities. Note Requirements: This lesson requires a "VernierGo" temperature sensing device, available for ~ $40. This item is part of the Concord Consortium, a nonprofit research and development organization dedicated to transforming education through technology. The Consortium develops digital learning innovations for science, mathematics, and engineering.
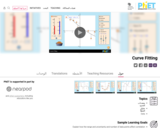
With your mouse, drag data points and their error bars, and watch …
With your mouse, drag data points and their error bars, and watch the best-fit polynomial curve update instantly. You choose the type of fit: linear, quadratic, cubic, or quartic. The reduced chi-square statistic shows you when the fit is good. Or you can try to find the best fit by manually adjusting fit parameters.
The student will use previously collected personal and peer data (Part 1: …
The student will use previously collected personal and peer data (Part 1: Screen Time Logs) to graph a bar and pie graph in Slides using Sheets to graph the data collected.This is the second part of an intended presentation project for a computer CTE middle school class, but can be edited and adapted for any graphing and/or computer integration lessons about bar and pie graphs and how to make them in Google Sheets using Google Slides.
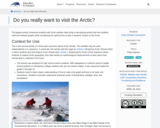
This jigsaw activity introduces students with Arctic weather data using a role-playing …
This jigsaw activity introduces students with Arctic weather data using a role-playing activity that has students read and interpret graphs while considering the optimal time to plan a research mission to the Arctic.
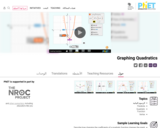
Learn about graphing polynomials. The shape of the curve changes as the …
Learn about graphing polynomials. The shape of the curve changes as the constants are adjusted. View the curves for the individual terms (e.g. y=bx ) to see how they add to generate the polynomial curve.
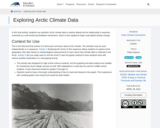
In this activity, students use authentic Arctic climate data to explore albedo …
In this activity, students use authentic Arctic climate data to explore albedo and its relationship to seasonal snowmelt as a self-reinforcing feedback mechanism, which is then applied to large scale global climate change.
This assessment should be used to determine the students’ ability to read …
This assessment should be used to determine the students’ ability to read and interpret data using pictographs and bar graphs. It should be utilized at the end of the graphing unit.
This task requires students to use the fact that on the graph …
This task requires students to use the fact that on the graph of the linear function h(x)=ax+b, the y-coordinate increases by a when x increases by one. Specific values for a and b were left out intentionally to encourage students to use the above fact as opposed to computing the point of intersection, (p,q), and then computing respective function values to answer the question. The Virginia Department of Education resource titled, "Graphing Linear Functions," which requires students to graph equations in y=mx + b form includes a template and lesson plan.
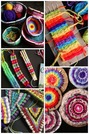
1. Have the students bring a Math graphing problem that they have …
1. Have the students bring a Math graphing problem that they have been working on in class. **This will take some coordination with their homeroom teacher in order to work! or present a simple graphing problem for them to solve. It needs to have 3-4 variables. This is so that they can use 3-4 coordinating colors of yarn for their design.In this lesson, we will translate the bar graph chart into a horizontal graph design. Use the numbers to represent rows of weaving. For example, if a 5 is represented in the information then color in a section of rows on the graph paper to represent 5 rows that will be woven in that color. Tell the students to use the same colors that they have on their math bar graph, when creating their graph for weaving so that there is less confusion.
This activity is designed to help students understand the classification system of …
This activity is designed to help students understand the classification system of stars on the H-R diagram. This activity will practice graphing skills and interpretation skills. Students will be able to answer attached questions regarding the H-R diagram.
No restrictions on your remixing, redistributing, or making derivative works. Give credit to the author, as required.
Your remixing, redistributing, or making derivatives works comes with some restrictions, including how it is shared.
Your redistributing comes with some restrictions. Do not remix or make derivative works.
Most restrictive license type. Prohibits most uses, sharing, and any changes.
Copyrighted materials, available under Fair Use and the TEACH Act for US-based educators, or other custom arrangements. Go to the resource provider to see their individual restrictions.