This resource consists of a Java applet and expository text. The applet …
This resource consists of a Java applet and expository text. The applet simulates coin tosses. The number of coins and the probability of heads can be varied.
Introducing Data collection and Analysis: This activity include a data collection sheet …
Introducing Data collection and Analysis: This activity include a data collection sheet and questions to analyze the data. The activity can be done as a whole group, small group, or by individual students. Estimated time from start to finish is 30-45 minutes based on prior knowledge.
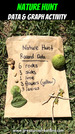
In this lesson students will collect items in nature. They will then …
In this lesson students will collect items in nature. They will then count, graph, and analyze the data they collected. The lesson is set up to use a bar graph, but any graph can be used.
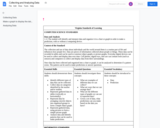
Constructing and analyzing scatterplotsMathematics Instructional Plans (MIPs) help teachers align instruction with …
Constructing and analyzing scatterplotsMathematics Instructional Plans (MIPs) help teachers align instruction with the 2016 Mathematics Standards of Learning (SOL) by providing examples of how the knowledge, skills and processes found in the SOL and curriculum framework can be presented to students in the classroom
This resource consists of a Java applet and expository text. The applet …
This resource consists of a Java applet and expository text. The applet is a simulation of the coupon collector problem, which consists of sampling from the first m positive integers, with replacement, until k distinct values are obtained. The parameters m and k can be varied. The random variable of interest is the size of the sample.
This resource consists of a Java applet and expository text. The applet …
This resource consists of a Java applet and expository text. The applet is a simulation of the standard casino craps game. The random variables of interest are the winning under various bets.
With your mouse, drag data points and their error bars, and watch …
With your mouse, drag data points and their error bars, and watch the best-fit polynomial curve update instantly. You choose the type of fit: linear, quadratic, cubic, or quartic. The reduced chi-square statistic shows you when the fit is good. Or you can try to find the best fit by manually adjusting fit parameters.
Investigating forms of data collectionMathematics Instructional Plans (MIPs) help teachers align instruction …
Investigating forms of data collectionMathematics Instructional Plans (MIPs) help teachers align instruction with the 2016 Mathematics Standards of Learning (SOL) by providing examples of how the knowledge, skills and processes found in the SOL and curriculum framework can be presented to students in the classroom.
Exploring data collection and graphing -- Mathematics Instructional Plans (MIPs) help teachers align …
Exploring data collection and graphing -- Mathematics Instructional Plans (MIPs) help teachers align instruction with the 2016 Mathematics Standards of Learning (SOL) by providing examples of how the knowledge, skills and processes found in the SOL and curriculum framework can be presented to students in the classroom.
This resource consists of a Java applet and expository text. The applet …
This resource consists of a Java applet and expository text. The applet simulates rolling n dice. The random variables of interest are the sum of the scores, the maximum score, the minimum score, and the number of aces. The number of dice and the probability distribution that governs the dice can be specified. The applet illustrates various distributions and the central limit theorem.
This resource consists of a Java applet and expository text. The applet …
This resource consists of a Java applet and expository text. The applet simulates the rolling of n dice. The number of dice and the probability distribution that governs the dice can be specified.
This resource consists of a Java applet and expository text. The applet …
This resource consists of a Java applet and expository text. The applet simulates the experiment of rolling a die and then tossing a coin the number of times shown on the die. The die distribution and the probability of heads can be specified. The applet illustrates a two-stage experiment.
Determining the effect on measures of center when a single value of …
Determining the effect on measures of center when a single value of a data set is added, removed, or changed Mathematics Instructional Plans (MIPs) help teachers align instruction with the 2016 Mathematics Standards of Learning (SOL) by providing examples of how the knowledge, skills and processes found in the SOL and curriculum framework can be presented to students in the classroom.
This Science lesson covers Science SOL 1.1 i and reviews Math SOL …
This Science lesson covers Science SOL 1.1 i and reviews Math SOL 1.12. In this lesson the students will identify the color of their eyes and use this information to make a pictograph. The class will make a class graph with the option of students then creating their own graph. The students will then analyze the pictograph and answer questions.
This resource consists of a Java applet and expository text. The applet …
This resource consists of a Java applet and expository text. The applet is a simulation of the experiment of selecting n objects at random from the first m positive integers. The random variables of interest are the order statistics. The applet illustrates the distributions of the order statistics.
This resource consists of a Java applet and expository text. The applet …
This resource consists of a Java applet and expository text. The applet is a simulation of the fire process, an interacting particle system consisting of a rectangular lattice of "trees". At each discrete time unit, each tree is either on green, on fire, or burnt. A tree on fire at a given time can catch neighboring trees on fire at the next time unit. The probabilities of fire spread can be varied.
Students analyze the number of French fries in an average restaurant bag …
Students analyze the number of French fries in an average restaurant bag through understanding median, upper and lower quartiles and building box plots.
This resource consists of a Java applet and descriptive text. The applet …
This resource consists of a Java applet and descriptive text. The applet illustrates Bernoulli trials in terms of a Galton Board. The number of trials and the probability of success can be varied. The random variables of interest are the number of successes and the probability of a success. The applet illustrates the binomial distribution, the law of large numbers and the central limit theorem.
This resource consists of a Java applet and expository text. The applet …
This resource consists of a Java applet and expository text. The applet illustrates the Galton board in which a ball falls through a triangular array of pegs. Various combinatorial ideas are illustrated, including combinations, bit strings, and binomial coefficients.
This resource consists of a Java applet and expository text. The applet …
This resource consists of a Java applet and expository text. The applet simulates a random sample from a gamma distribution, and computes standard point estimates of the shape and scale parameters. The bias and mean square error are also computed.
No restrictions on your remixing, redistributing, or making derivative works. Give credit to the author, as required.
Your remixing, redistributing, or making derivatives works comes with some restrictions, including how it is shared.
Your redistributing comes with some restrictions. Do not remix or make derivative works.
Most restrictive license type. Prohibits most uses, sharing, and any changes.
Copyrighted materials, available under Fair Use and the TEACH Act for US-based educators, or other custom arrangements. Go to the resource provider to see their individual restrictions.