Compare Histograms to stem-and-leaf, line plots and circle graphs.Mathematics Instructional Plans (MIPs) …
Compare Histograms to stem-and-leaf, line plots and circle graphs.Mathematics Instructional Plans (MIPs) help teachers align instruction with the 2016 Mathematics Standards of Learning (SOL) by providing examples of how the knowledge, skills and processes found in the SOL and curriculum framework can be presented to students in the classroom.
Collecting, organizing, representing, interpreting, and comparing data using line graphs Mathematics Instructional Plans …
Collecting, organizing, representing, interpreting, and comparing data using line graphs Mathematics Instructional Plans (MIPs) help teachers align instruction with the 2016 Mathematics Standards of Learning (SOL) by providing examples of how the knowledge, skills and processes found in the SOL and curriculum framework can be presented to students in the classroom.
Representing mean as the balance point Mathematics Instructional Plans (MIPs) help teachers align …
Representing mean as the balance point Mathematics Instructional Plans (MIPs) help teachers align instruction with the 2016 Mathematics Standards of Learning (SOL) by providing examples of how the knowledge, skills and processes found in the SOL and curriculum framework can be presented to students in the classroom.
This resource consists of a Java applet and expository text. The applet …
This resource consists of a Java applet and expository text. The applet is a simulation of the ballot experiment: The votes in an election are randomly counted. The event of interest is that the winning candidate is always ahead in the vote count.
This lesson has students complete a basketball activity and then use the …
This lesson has students complete a basketball activity and then use the data from the activity to create a scatterplot. Once they create their scatterplot they determine correlation and draw a line of best fit.
This resource consists of a Java applet and expository text. The applet …
This resource consists of a Java applet and expository text. The applet is a simulation of Bertrand's experiment: a random chord on a circle The event of interest is whether the length of the chord is larger than the length of the inscribed equilateral triangle. Three models for generating the random chord can be used.
This resource consists of a Java applet and expository text. The applet …
This resource consists of a Java applet and expository text. The applet illustrates Bayesian estimation of the probability of heads for a coin. The prior beta distribution, true probability of heads, and the sample size can be specified. The applet shows the posterior beta distribution.
This resource consists of a Java applet and expository text. The applet …
This resource consists of a Java applet and expository text. The applet simulates a random sample from a beta distribution, and computes standard point estimates of the left and right parameters. The bias and mean square error are also computed.
This resource consist of a Java applet and expository text. The applet …
This resource consist of a Java applet and expository text. The applet simulates Bernoulli trials in terms of coin tosses. The random variables of interest are the number of heads and the proportion of heads. The number of coins and the probability of heads can be varied. The applet illustrates the law of large numbers and the central limit theorem.
This resource consists of a Java applet and expository text. The applet …
This resource consists of a Java applet and expository text. The applet simulates Bernoulli trials in terms of random points on a timeline. The random variables of interest are the number of successes and the proportion of successes. The number of trials and the probability of success can be varied. This applet illustrates the law of large numbers, the central limit theorem, and the binomial distribution.
This resource consists of a Java applet and expository text. The applet …
This resource consists of a Java applet and expository text. The applet is a simulation of the birthday experiment: a sample of size n is chose at random and with replacement from the first m positive integers. The random variable of interest is the number of distinct sample values. The event of interest is that all sample values are distinct.
This resource consists of a Java applet and expository text. The applet …
This resource consists of a Java applet and expository text. The applet simulates the bivariate normal distribution. The means are set at 0, but the standard deviations and the correlation can be varied. Simulated points from the distribution are shown as dots in a scatterplot.
This resource consists of a Java applet and expository text. The Java …
This resource consists of a Java applet and expository text. The Java applet illustrates the bivariate uniform distribution on three types of regions: a square, a circle, and a triangle. Simulated points from the distribution are shown as dots in a scatterplot.
This resource consists of a Java applet and expository text. The applet …
This resource consists of a Java applet and expository text. The applet simulates Buffon's coin experiment. The radius of the coin can be varied. The applet illustrates a random experiment, the sample space, random variables, events, probability, and relative frequency.
This resource consists of a Java applet and expository text. The applet …
This resource consists of a Java applet and expository text. The applet simulates Buffon's needle experiment and the corresponding approximation of pi. The event of interest is that the needle crosses a crack. The length of the needle can be varied. The applet illustrates a random experiment, the sample space, random variables, probability, and relative frequency.
This resource consists of a Java applet and expository text. The applet …
This resource consists of a Java applet and expository text. The applet is a simulation of drawing n cards from a standard deck. The parameter n can be varied.
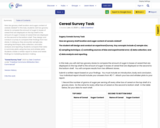
How are grocery shelf location and sugar content of cereals related? In …
How are grocery shelf location and sugar content of cereals related? In this task, students visit two grocery stores to compare the amount of sugar in boxes of cereal that are displayed on the top shelf to the amount of sugar in boxes of cereal that are displayed on the second to the bottom shelf. They design and conduct a survey to compare their findings from two stores. In doing so, they encounter sample size, sampling technique, data collection, and data analysis and reporting. Students compare their data in summary plots using two box and whisker plots. Students create a written report to share and relate findings to marketing decision making.
This resource consists of a Java applet and expository text. The applet …
This resource consists of a Java applet and expository text. The applet simulates the chuck-a-luck experiment of rolling 3 fair dice. The random variable of interest is the net profit of the player.
This mini lesson is a slides presentation on circle graph. It's about …
This mini lesson is a slides presentation on circle graph. It's about how much time students spend on homework. The lesson has questions pertaining to the topics and which one is more or less. etc.
This resource consists of a Java applet and expository text. The applet …
This resource consists of a Java applet and expository text. The applet is a simulation of the experiment that consists of tossing a coin and then rolling either a red die or a green die, depending on the outcome of the coin toss. The probability of heads and the distributions of the two dice can be specified. The applet illustrates a two-stage experiment.
No restrictions on your remixing, redistributing, or making derivative works. Give credit to the author, as required.
Your remixing, redistributing, or making derivatives works comes with some restrictions, including how it is shared.
Your redistributing comes with some restrictions. Do not remix or make derivative works.
Most restrictive license type. Prohibits most uses, sharing, and any changes.
Copyrighted materials, available under Fair Use and the TEACH Act for US-based educators, or other custom arrangements. Go to the resource provider to see their individual restrictions.