Updating search results...

Search Resources

5 Results

View
Selected filters:
  • satellite-data
Estimating Primary Production in the Oceans from Satellite Data
Conditional Remix & Share Permitted
CC BY-NC-SA
Rating
0.0 stars

In this computer lab, students use satellite imagery, daylength information, and phytoplankton physiology models to calculate annual primary production for an assigned ocean region.Satellite data is obtained from the NASA Earth Observation website. Students use the analysis tool to determine chlorophyll concentration and sea surface temperature. They also receive a day-length calculator and are asked to model light transmission through the water column. Using step-by-step instructions and proviede equations relating phytoplankton physiology to irradiance and temperature students calculate carbon uptake at discreet locations in the water column. The second half of the exercise involves scaling up to the entire water column, region, and season. Students present their work to the class and evaluate their result using scientific literature. Differences between regions are then discussed by the class.

Subject:
Earth and Space Systems
Living Systems and Processes
Matter
Science
Material Type:
Activity/Lab
Data Set
Provider:
Science Education Resource Center (SERC) at Carleton College
Provider Set:
Pedagogy in Action
Author:
Kevin Arrigo
Date Added:
05/29/2019
Investigating the Ocean:  Exploring ecological provinces using satellite imagery and oceanographic cruise data
Conditional Remix & Share Permitted
CC BY-NC-SA
Rating
0.0 stars

In this activity, students are split into groups and assigned different ocean regions. These include the Arabian Sea, Equatorial Pacific, North Atantic, and Southern Ocean. Each group uses Google Earth to view NASA satellite chlorophyll imagery and the cruise track of data collected as part of the U.S. Joint Global Ocean Flux Study. At three locations along each cruise track, chlorophyll-temperature-depth (CTD) and bottle data collected as part of the study can be downloaded. Students work with the data to identify oceanographic features as a function of depth and then make simple calculations.

Subject:
Earth and Space Systems
Living Systems and Processes
Science
Material Type:
Activity/Lab
Data Set
Provider:
Science Education Resource Center (SERC) at Carleton College
Provider Set:
Pedagogy in Action
Author:
Kevin Arrigo
Date Added:
05/29/2019
NASA eClips Our World:  Where Do Crops Grow?
Unrestricted Use
Public Domain
Rating
0.0 stars

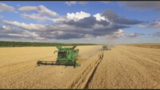
Video Description:  Have you ever wondered where food comes from? Learn how Dr. Catherine Nakalembe uses NASA satellite data to show the health and location of crops around Our World. Maps created from these data help people become more food secure. You can help, too. Using the GLOBE Observer App, you can help scientists validate satellite data by describing land covering through the Adopt a Pixel program.  Video Length:  5:23.    NASA eClipsTM is a suite of online student-centered, standards-based resources that support instruction by increasing STEM literacy in formal and nonformal settings.  These free digital and downloadable resources inform and engage students through NASA-inspired, real-world connections.NASA eClips Our World videos (grades 3-5) help students understand the differences between science (the natural world) and engineering (the designed world).  These video segments supplement elementary learning objectives not only in science, technology, engineering and mathematics, but also in reading, writing, visual and performing arts. 

Subject:
Agricultural Education
Algorithms and Programming
Data and Analysis
Earth Resources
Impacts of Computing
STEM/STEAM
Science
Material Type:
Visual Media
Author:
Betsy McAllister
Date Added:
01/19/2022
NASA eClips Real World:  The Carbon Cycle - Essential for Life on Earth
Unrestricted Use
Public Domain
Rating
0.0 stars

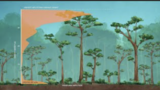
 NASA eClips Real World:  The Carbon Cycle - Essential for Life on EarthVideo Description:  Carbon is an essential building block for life. Learning how carbon is converted through slow- and fast-moving cycles helps us understand how this life-sustaining element moves through the environment. Discover how NASA measures carbon through both field work and satellite imagery keeping watch through its eyes on the sky, on Earth, and in space.  This video won and Emmy Award in 2020.  Video Length:  5:43.NASA eClipsTM is a suite of online student-centered, standards-based resources that support instruction by increasing STEM literacy in formal and nonformal settings.  These free digital and downloadable resources inform and engage students through NASA-inspired, real-world connections.NASA eClips Real World segments (grades 6-8) connect classroom mathematics to 21st Century careers and innovations.  They are designed for students to develop an appreciation for mathematics through real-world problem solving.  

Subject:
Algorithms and Programming
Data and Analysis
Living Systems and Processes
STEM/STEAM
Science
Material Type:
Visual Media
Author:
Betsy McAllister
Date Added:
01/21/2022
Using Satellite Data and Google Earth to Explore the Shape of Ocean Basins and Bathymetry of the Sea Floor
Conditional Remix & Share Permitted
CC BY-NC-SA
Rating
0.0 stars

This activity is for an introductory oceanography course. It is designed to allow students to use various tools (satellite images, Google Earth) to explore the shape of the sea floor and ocean basins in order to gain a better understanding of both the processes that form ocean basins, as well as how the shape of ocean basins influences physical and biological processes.

Subject:
Earth and Space Systems
Force/Motion/Energy
Science
Material Type:
Activity/Lab
Data Set
Provider:
Science Education Resource Center (SERC) at Carleton College
Provider Set:
Pedagogy in Action
Author:
Molly Palmer
Date Added:
05/29/2019