Updating search results...

Search Resources

6 Results

View
Selected filters:
  • VA.MTH.ALG2.9 - The student will collect and analyze data, determine the equation of t...
Curve Fitting
Unrestricted Use
CC BY
Rating
0.0 stars

With your mouse, drag data points and their error bars, and watch the best-fit polynomial curve update instantly. You choose the type of fit: linear, quadratic, cubic, or quartic. The reduced chi-square statistic shows you when the fit is good. Or you can try to find the best fit by manually adjusting fit parameters.

Subject:
Mathematics
Material Type:
Simulation
Provider:
University of Colorado Boulder
Provider Set:
PhET Interactive Simulations
Author:
Michael Dubson
Trish Loeblein
Date Added:
08/01/2008
Curve Fitting Remix
Conditional Remix & Share Permitted
CC BY-NC
Rating
0.0 stars

With your mouse, drag data points and their error bars, and watch the best-fit polynomial curve update instantly. You choose the type of fit: linear, quadratic, cubic, or quartic. The reduced chi-square statistic shows you when the fit is good. Or you can try to find the best fit by manually adjusting fit parameters.

Subject:
Algebra I & II
Mathematics
Probability and Statistics
Material Type:
Activity/Lab
Date Added:
12/03/2019
Curve of Best Fit
Conditional Remix & Share Permitted
CC BY-NC
Rating
0.0 stars

Collecting and analyzing data, using curve of best fit Mathematics Instructional Plans (MIPs) help teachers align instruction with the 2016 Mathematics Standards of Learning (SOL) by providing examples of how the knowledge, skills and processes found in the SOL and curriculum framework can be presented to students in the classroom.

Subject:
Algebra I & II
Mathematics
Material Type:
Lesson Plan
Author:
Virginia Hodge
Tina Mazzacane
Date Added:
05/15/2020
Egg Launch Task_Quadratics
Conditional Remix & Share Permitted
CC BY-NC
Rating
0.0 stars

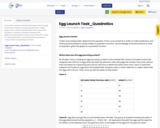
In this task, students decide which team wins the egg-launching contest by analyzing data from a table, graph and a verbal representation with a quadratic equation. In doing so, students analyze data, determine the equation of the curve of best fit in order to make predictions, and solve practical problems using models of quadratic functions.

Subject:
Algebra I & II
Mathematics
Material Type:
Activity/Lab
Assessment
Date Added:
01/08/2020
Grade 11 Module 1: Polynomial, Rational, and Radical Relationships
Conditional Remix & Share Permitted
CC BY-NC-SA
Rating
0.0 stars

In this module, students draw on their foundation of the analogies between polynomial arithmetic and base-ten computation, focusing on properties of operations, particularly the distributive property. Students connect multiplication of polynomials with multiplication of multi-digit integers and division of polynomials with long division of integers. Students identify zeros of polynomials, including complex zeros of quadratic polynomials, and make connections between zeros of polynomials and solutions of polynomial equations. Students explore the role of factoring, as both an aid to the algebra and to the graphing of polynomials. Students continue to build upon the reasoning process of solving equations as they solve polynomial, rational, and radical equations, as well as linear and non-linear systems of equations. The module culminates with the fundamental theorem of algebra as the ultimate result in factoring. Students pursue connections to applications in prime numbers in encryption theory, Pythagorean triples, and modeling problems.
To access this resource, you will need to create a free account for the system on which it resides. The partner provides personalized features on their site such as bookmarking and highlighting which requires a user account.

Subject:
Mathematics
Material Type:
Module
Provider:
Eureka Math (Great Minds)
Date Added:
11/19/2019
Grade 11 Module 3: Exponential and Logarithmic Functions
Conditional Remix & Share Permitted
CC BY-NC-SA
Rating
0.0 stars

In this module, students synthesize and generalize what they have learned about a variety of function families. They extend the domain of exponential functions to the entire real line and then extend their work with these functions to include solving exponential equations with logarithms. They use appropriate tools to explore the effects of transformations on graphs of exponential and logarithmic functions. They notice that the transformations of a graph of a logarithmic function relate to the logarithmic properties. Students identify appropriate types of functions to model a situation. They adjust parameters to improve the model, and they compare models by analyzing appropriateness of fit and making judgments about the domain over which a model is a good fit. The description of modeling as "the process of choosing and using mathematics and statistics to analyze empirical situations, to understand them better, and to make decisions" is at the heart of this module. In particular, through repeated opportunities in working through the modeling cycle, students acquire the insight that the same mathematical or statistical structure can sometimes model seemingly different situations.
To access this resource, you will need to create a free account for the system on which it resides. The partner provides personalized features on their site such as bookmarking and highlighting which requires a user account.

Subject:
Mathematics
Material Type:
Module
Provider:
Eureka Math (Great Minds)
Date Added:
11/19/2019