Student will:analyze a map of the Chesapeake Baycalculate the mean, median, mode, …
Student will:analyze a map of the Chesapeake Baycalculate the mean, median, mode, range, and numbercreate an appropriate graphinvestigate data provided by the James River and apply learning
This learning video continues the theme of an early BLOSSOMS lesson, Flaws …
This learning video continues the theme of an early BLOSSOMS lesson, Flaws of Averages, using new examples—including how all the children from Lake Wobegon can be above average, as well as the Friendship Paradox. As mentioned in the original module, averages are often worthwhile representations of a set of data by a single descriptive number. The objective of this module, once again, is to simply point out a few pitfalls that could arise if one is not attentive to details when calculating and interpreting averages. Most students at any level in high school can understand the concept of the flaws of averages presented here. The essential prerequisite knowledge for this video lesson is the ability to calculate an average from a set of numbers. Materials needed include: pen and paper for the students; a blackboard or equivalent; and coins (one per student) or something similar that students can repeatedly use to create a random event with equal chances of the two outcomes (e.g. flipping a fair coin). The coins or something similar are recommended for one of the classroom activities, which will demonstrate the idea of regression toward the mean. Another activity will have the students create groups to show how the average number of friends of friends is greater than or equal to the average number of friends in a group, which is known as The Friendship Paradox. The lesson is designed for a typical 50-minute class session.
Students learn a simple technique for quantifying the amount of photosynthesis that …
Students learn a simple technique for quantifying the amount of photosynthesis that occurs in a given period of time, using a common water plant (Elodea). They can use this technique to compare the amounts of photosynthesis that occur under conditions of low and high light levels. Before they begin the experiment, however, students must come up with a well-worded hypothesis to be tested. After running the experiment, students pool their data to get a large sample size, determine the measures of central tendency of the class data, and then graph and interpret the results.
Students use U.S. Geological Survey (USGS) real-time, real-world seismic data from around …
Students use U.S. Geological Survey (USGS) real-time, real-world seismic data from around the planet to identify where earthquakes occur and look for trends in earthquake activity. They explore where and why earthquakes occur, learning about faults and how they influence earthquakes. Looking at the interactive maps and the data, students use Microsoft® Excel® to conduct detailed analysis of the most-recent 25 earthquakes; they calculate mean, median, mode of the data set, as well as identify the minimum and maximum magnitudes. Students compare their predictions with the physical data, and look for trends to and patterns in the data. A worksheet serves as a student guide for the activity.
This is a google slides mini lesson on finding the mean of …
This is a google slides mini lesson on finding the mean of a set of data. The first slide consists of the definition of mean. Students will solve what a mean is and will make a text box and type the answer in it, then complete the slides.
Mic Drop Maths is a mathematics podcast for 5th graders based on …
Mic Drop Maths is a mathematics podcast for 5th graders based on the VA Standards of Learning. Each episode addresses one standard and is broken into segments including concept, real-world application, math history, literature connections, misconceptions, and more! There is music, sound effects, jokes, and student voice in each engaging and entertaining episode.
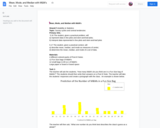
This resource involves students completing a series of four graphs representing how …
This resource involves students completing a series of four graphs representing how many M&M's they predict are in fun size and small bags of M&M's, and the actual number that are present. After collecting data and graphing the results, students will place the data on stem and leaf plots. Next, students will determine the mean, mode, and median for each set of data, and decide which measure of center is most accurate for describing the number of M&M's in the bag. Lastly, students will compare the amount of M&Ms in the fun size bag to those in the small bag.
Students experience data collection, analysis and inquiry in this LEGO® MINDSTORMS® NXT …
Students experience data collection, analysis and inquiry in this LEGO® MINDSTORMS® NXT -based activity. They measure the position of an oscillating platform using a ultrasonic sensor and perform statistical analysis to determine the mean, mode, median, percent difference and percent error for the collected data.
Students learn about the statistical analysis of measurements and error propagation, reviewing …
Students learn about the statistical analysis of measurements and error propagation, reviewing concepts of precision, accuracy and error types. This is done through calculations related to the concept of density. Students work in teams to each measure the dimensions and mass of five identical cubes, compile the measurements into small data sets, calculate statistics including the mean and standard deviation of these measurements, and use the mean values of the measurements to calculate density of the cubes. Then they use this calculated density to determine the mass of a new object made of the same material. This is done by measuring the appropriate dimensions of the new object, calculating its volume, and then calculating its mass using the density value. Next, the mass of the new object is measured by each student group and the standard deviation of the measurements is calculated. Finally, students determine the accuracy of the calculated mass by comparing it to the measured mass, determining whether the difference in the measurements is more or less than the standard deviation.
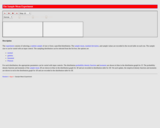
The resource consists of a Java applet and expository text. The applet …
The resource consists of a Java applet and expository text. The applet illustrates the distribution of the sample mean of a random sample from a given distribution. The sample size and the sampling distribution can be specified. The applet illustrates the central limit theorem.
Students apply pre-requisite statistics knowledge and concepts learned in an associated lesson …
Students apply pre-requisite statistics knowledge and concepts learned in an associated lesson to a real-world state-of-the-art research problem that asks them to quantitatively analyze the effectiveness of different cracked steel repair methods. As if they are civil engineers, students statistically analyze and compare 12 sets of experimental data from seven research centers around the world using measurements of central tendency, five-number summaries, box-and-whisker plots and bar graphs. The data consists of the results from carbon-fiber-reinforced polymer patched and unpatched cracked steel specimens tested under the same stress conditions. Based on their findings, students determine the most effective cracked steel repair method, create a report, and present their results, conclusions and recommended methods to the class as if they were presenting to the mayor and city council. This activity and its associated lesson are suitable for use during the last six weeks of the AP Statistics course; see the topics and timing note for details.
This 11-minute video lesson looks at the the central limit theorem and …
This 11-minute video lesson looks at the the central limit theorem and the sampling distribution of the sample mean. [Statistics playlist: Lesson 36 of 85]
This 13-minute video lesson provides more discussion of the Central Limit Theorem …
This 13-minute video lesson provides more discussion of the Central Limit Theorem and the Sampling Distribution of the Sample Mean. [Statistics playlist: Lesson 37 of 85]
No restrictions on your remixing, redistributing, or making derivative works. Give credit to the author, as required.
Your remixing, redistributing, or making derivatives works comes with some restrictions, including how it is shared.
Your redistributing comes with some restrictions. Do not remix or make derivative works.
Most restrictive license type. Prohibits most uses, sharing, and any changes.
Copyrighted materials, available under Fair Use and the TEACH Act for US-based educators, or other custom arrangements. Go to the resource provider to see their individual restrictions.