Describing and determining mean, median, mode, and range of a set of data - Mathematics Instructional Plan
- Subject:
- Mathematics
- Material Type:
- Lesson Plan
- Provider:
- VDOE
- Author:
- VDOE
- Date Added:
- 10/07/2024

Describing and determining mean, median, mode, and range of a set of data - Mathematics Instructional Plan

Student will:analyze a map of the Chesapeake Baycalculate the mean, median, mode, range, and numbercreate an appropriate graphinvestigate data provided by the James River and apply learning

This is a google slides mini lesson on finding the median of a set of data. The first slide consists of a definition of median. Students will solve what the median is and make a text box and type the answer. Then, they will complete all slides.

Students analyze the number of French fries in an average restaurant bag through understanding median, upper and lower quartiles and building box plots.

Just in Time Quick Check Measures of Center

Just in Time Quick Check Determine Mean, Median, Mode, and Range

Mic Drop Maths is a mathematics podcast for 5th graders based on the VA Standards of Learning. Each episode addresses one standard and is broken into segments including concept, real-world application, math history, literature connections, misconceptions, and more! There is music, sound effects, jokes, and student voice in each engaging and entertaining episode.

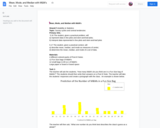
This resource involves students completing a series of four graphs representing how many M&M's they predict are in fun size and small bags of M&M's, and the actual number that are present. After collecting data and graphing the results, students will place the data on stem and leaf plots. Next, students will determine the mean, mode, and median for each set of data, and decide which measure of center is most accurate for describing the number of M&M's in the bag. Lastly, students will compare the amount of M&Ms in the fun size bag to those in the small bag.