Students use a hurricane tracking map to measure the distance from a …
Students use a hurricane tracking map to measure the distance from a specific latitude and longitude location of the eye of a hurricane to a city. Then they use the map's scale factor to convert the distance to miles. They also apply the distance formula by creating an x-y coordinate plane on the map. Students are challenged to analyze what data might be used by computer science engineers to write code that generates hurricane tracking models. Then students analyze a MATLAB® computer code that uses the distance formula repetitively to generate a table of data that tracks a hurricane at specific time intervals. Students come to realize that using a computer program to generate the calculations (instead of by hand) is very advantageous for a dynamic situation like tracking storm movements. Their inspection of some MATLAB code helps them understand how it communicates what to do using mathematical formulas, logical instructions and repeated tasks. They also conclude that the example program is too simplistic to really be a useful tool; useful computer model tools must necessarily be much more complex.
This is a data collection, prediction, and graphing activity using three flavors …
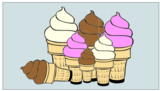
This is a data collection, prediction, and graphing activity using three flavors of ice cream as the subject. It is a ready-made lesson with a Google Slideshow that has all of the activities built into it.
Students complete an exercise showing logarithmic relationships and examine how to find …
Students complete an exercise showing logarithmic relationships and examine how to find the linear regression of data that does not seem linear upon initial examination. They relate number of BMD scanners to time.
How did scientists figure out the structure of atoms without looking at …
How did scientists figure out the structure of atoms without looking at them? Try out different models by shooting light at the atom. Check how the prediction of the model matches the experimental results.
Video Description: Our Earth is a dynamic system with diverse subsystems that interact …
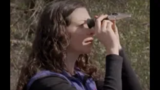
Video Description: Our Earth is a dynamic system with diverse subsystems that interact in complex ways.What are those subsystems and how do they interact?How are these subsystems and the global Earth system changing?What causes these changes?How does NASA monitor these changes?How can Earth system science provide societal benefit?Jessica Taylor, an atmospheric scientist at NASA Langley Research Center, and Dr. Steven Pawson, an Earth scientist from NASA Goddard Space Flight Center, help answer these questions and demonstrate how mathematical modeling helps scientists in their predictions of climate, weather, and natural hazards. Video Length: 5:02.NASA eClips Real World segments (grades 6-8) connect classroom mathematics to 21st Century careers and innovations. They are designed for students to develop an appreciation for mathematics through real-world problem solving.
Students act as civil engineers developing safe railways as a way to …
Students act as civil engineers developing safe railways as a way to strengthen their understanding of parallel and intersecting lines. Using pieces of yarn to visually represent line segments, students lay down "train tracks" on a carpeted floor, and make guesses as to whether these segments are arranged in parallel or non-parallel fashion. Students then test their tracks by running two LEGO® MINDSTORMS® NXT robots to observe the consequences of their track designs, and make safety improvements. Robots on intersecting courses face imminent collision, while robots on parallel courses travel safely.
Students learn about the concept of pushing, as well as the relationship …
Students learn about the concept of pushing, as well as the relationship between force and mass. Students practice measurement skills using pan scales and rulers to make predictions about mass and distance. A LEGO MINDSTORMS(TM) NXT robot is used to test their hypotheses. By the end of the activity, students have a better understanding of robotics, mass and friction and the concept of predicting.
Students see and learn how crystallization and inhibition occur by making sugar …
Students see and learn how crystallization and inhibition occur by making sugar crystals with and without additives in a supersaturation solution, testing to see how the additives may alter crystallization, such as by improving crystal growth by more or larger crystals. After three days, students analyze the differences between the control crystals and those grown with additives, researching and attempting to deduce why certain additives blocked crystallization, showed no change or improved growth. Students relate what they learn from the rock candy experimentation to engineering drug researchers who design medicines for targeted purposes in the human body. Conduct the first half of this activity one day before presenting the associated lesson, Body Full of Crystals. Then conduct the second half of the activity.
Through this activity, students come to understand the environmental design considerations required …
Through this activity, students come to understand the environmental design considerations required when generating electricity. The electric power that we use every day at home and work is usually generated by a variety of power plants. Power plants are engineered to utilize the conversion of one form of energy to another. The main components of a power plant are an input source of energy that is used to turn large turbines, and a method to convert the turbine rotation into electricity. The input sources of energy include fossil fuels (coal, natural gas and oil), wind, water, nuclear materials and refuse. This activity focuses on how much energy can be converted to electricity from many of these input sources. It also considers the impact of the by-products associated with using these natural resources, and looks at electricity requirements. To do this, students research and evaluate the electricity needs of their community, the available local resources for generating electricity, and the impact of using those resources.
In this group activity, learners use some common objects and work together …
In this group activity, learners use some common objects and work together to simulate the Coriolis effect. During the challenge, learners make predictions and test different scenarios. This resource includes background information about the Coriolis effect and helpful hints.
Students will predict how many amusement parks are in their state. They …
Students will predict how many amusement parks are in their state. They will then analyze census data on the numbers of amusement parks in all 50 states in 2016. (Data in this activity do not include the District of Columbia or Puerto Rico.) Then students will write numbers as fractions and create a visual model of the data.
No restrictions on your remixing, redistributing, or making derivative works. Give credit to the author, as required.
Your remixing, redistributing, or making derivatives works comes with some restrictions, including how it is shared.
Your redistributing comes with some restrictions. Do not remix or make derivative works.
Most restrictive license type. Prohibits most uses, sharing, and any changes.
Copyrighted materials, available under Fair Use and the TEACH Act for US-based educators, or other custom arrangements. Go to the resource provider to see their individual restrictions.