Representing, interpreting, and comparing data displayed in line plots and stem-and-leaf plots - Mathematics Instructional Plan
- Subject:
- Mathematics
- Material Type:
- Lesson Plan
- Provider:
- VDOE
- Author:
- VDOE
- Date Added:
- 10/07/2024

Representing, interpreting, and comparing data displayed in line plots and stem-and-leaf plots - Mathematics Instructional Plan

Data Representation and Interpretation; Focus on Stem and Leaf Plots - Algebra Readiness Remediation Plan

Data representation and interpretation - Algebra Readiness Remediation Plan

Choosing a graphical method that best displays a set of data - Algebra Readiness Remediation Plan

Data Representation and Interpretation - Algebra Readiness Remediation Plan

Just in Time Quick Check Line Plots and Stem-and-Leaf Plots

Just in Time Quick Check Interpret Line Plots and Stem-and-Leaf Plots

Just in Time Quick Check Compare Data Represented in Line Plots and Stem-and-Leaf Plots

Students will find helpful resources for learning and practicing math skills and processes in this eMediaVA collection.

This collection has resources organized by grade level teachers can use to teach math.

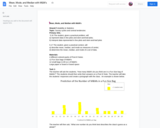
This resource involves students completing a series of four graphs representing how many M&M's they predict are in fun size and small bags of M&M's, and the actual number that are present. After collecting data and graphing the results, students will place the data on stem and leaf plots. Next, students will determine the mean, mode, and median for each set of data, and decide which measure of center is most accurate for describing the number of M&M's in the bag. Lastly, students will compare the amount of M&Ms in the fun size bag to those in the small bag.

Representing, interpreting, and comparing data displayed in line plots and stem-and-leaf plots. Mathematics Instructional Plans (MIPs) help teachers align instruction with the Mathematics Standards of Learning (SOL) by providing examples of how the knowledge, skills and processes found in the SOL and curriculum framework can be presented to students in the classroom.