Students explore the definition of a function by playing an interactive game …
Students explore the definition of a function by playing an interactive game called "Club Function." The goal of the game is to be in the club! With students each assigned to be either a zebra or a rhinoceros, they group themselves according to the "rules" of the club function. After two minutes, students freeze in their groups, and if they are not correctly following the rules of the club function, then they are not allowed into the "club." Through this activity students come to understand that one x-coordinate can only have one corresponding y-coordinate while y-coordinates can have many x-coordinates that correspond to it.
Students will examine a map projection of a chosen USGS topographic map …
Students will examine a map projection of a chosen USGS topographic map versus other maps. The teacher will explain that each map is drawn according to a specific map projection. Students will be given or shown a USGS poster of numerous map projections, as well as cartography in texts to illustrate how distance, direction, angle, or area have to be distorted.
Students use graph theory to create social graphs for their own social …
Students use graph theory to create social graphs for their own social networks and apply what learn to create a graph representing the social dynamics found in a dramatic text. Students then derive meaning based on what they know about the text from the graphs they created. Students learn graph theory vocabulary, as well as engineering applications of graph theory.
Students analyze their social networks using graph theory. They gather data on …
Students analyze their social networks using graph theory. They gather data on their own social relationships, either from Facebook interactions or the interactions they have throughout the course of a day, recording it in Microsoft Excel and using Cytoscape (a free, downloadable application) to generate social network graphs that visually illustrate the key persons (nodes) and connections between them (edges). The nodes in the Cytoscape graphs are color-coded and sized according to the importance of the node (in this activity, nodes are people in students' social networks). After the analysis, the graphs are further examined to see what can be learned from the visual representation. Students gain practice with graph theory vocabulary, including node, edge, betweeness centrality and degree on interaction, and learn about a range of engineering applications of graph theory.
Release of the film Green Book (2018) inspired renewed interest in the …
Release of the film Green Book (2018) inspired renewed interest in the experiences of African Americans when traveling in the United States during the 20th century. This inquiry-based lesson combines individual investigations with whole or small group analysis of primary sources and visual media to investigate the compelling question: How have the intersections of race and place impacted U.S. history and culture?
The marine environment is unique and requires technologies that can use sound …
The marine environment is unique and requires technologies that can use sound to gather information since there is little light underwater. The sea-floor is characterized using underwater sound and acoustical systems. Current technological innovations are allowing scientists to further understand and apply information about animal locations and habitat. Remote sensing and exploration with underwater vehicles allows scientists to map and understand the sea floor, and in some cases, the water column. In this lesson, the students will be shown benthic habitat images produced by GIS. These imaged will lead to a class discussion on why habitat mapping is useful and how current technology works to make bathymetry mapping possible. The teacher will then ask inquiry-based questions to have students brainstorm about the importance of bathymetry mapping.
Map of Africa coded by the number of underweight children per square …
Map of Africa coded by the number of underweight children per square kilometer. It is thus a measure of the absolute density of hungry individuals, a combination of hunger and population density.
Map of Asia color coded by infant mortality rate broken down by …
Map of Asia color coded by infant mortality rate broken down by nation or subnational units (akin to US states or Canadian provinces). Shows the international differences, but also shows the (less substantial) differences within nations. The categories for the color coding have been changed slightly from the international standards to better fit the situation in Asia.
Map of Europe color coded by infant mortality rate broken down by …
Map of Europe color coded by infant mortality rate broken down by nation or subnational units (akin to US states or Canadian provinces). Shows the international differences, but also shows the (less substantial) differences within nations. The categories for the color coding have been changed from the international standards to differentiate among the universally low infant mortality rates across Europe.
Students will use an Edpuzzle video to label their own map of …
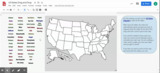
Students will use an Edpuzzle video to label their own map of the United States. The video is structured so students have to pause and label ten states at a time, in alphabetical order. The outcome of this activity is a completed US map for students' later reference. The second activity is a drag and drop game in which students drag labeled states into the appropriate spot on a map of the US. (Note: The state names in the activity have been color-coded according to geographic region. Students and teachers could use this later in the year to discuss regions and state locations.)
This outdoor investigation involves students observing, recording, comparing and pondering the differing …
This outdoor investigation involves students observing, recording, comparing and pondering the differing landscapes and rocks located along a river. Follow-up class sessions involve student generation of investigable questions, student-generated studies with required write-up and a mapping activity.
Map shows census divisions (a variably sized region ranging from 1100 and …
Map shows census divisions (a variably sized region ranging from 1100 and 2.5 million people) color coded by the percentage of people living in the area that lived in a different province or territory five years ago. CDs in sparsely populated regions are excluded. The map suggests that there is a great deal of migration into Alberta -- likely to work in the oil industry.
Projections and coordinates are key advancements in the geographic sciences that allow …
Projections and coordinates are key advancements in the geographic sciences that allow us to better understand the nature of the Earth and how to describe location. These innovations in describing the Earth are the basis for everything that is done in a GIS framework. Shape of the Earth is a critical starting point because in fact the Earth is not round but rather a more complex shape called a geoid. Coordinate systems are often referenced to a particular model shape of the Earth, but many different formats exist because not all coordinates work equally well in all areas. While projections and coordinates are abstract concepts in themselves, students eventually find them interesting because 1) it causes them to challenge their current ideas of the Earth's shape and 2) it is much easier to visualize these ideas for learning through interactive GIS such as Google Earth.
Students learn and practice how to find the perimeter of a polygonal …
Students learn and practice how to find the perimeter of a polygonal shape. Using a ruler, they measure model rooms made of construction paper walls. They learn about other tools, such as a robot, that can help them take measurements. Using a robot built from a LEGO® MINDSTORMS® NXT kit that has been programmed to move along a wall and output the length of that wall, students record measurements and compare the perimeter value found with the robot to the perimeter found using a ruler. In both cases, students sketch maps to the scale of the model room and label the measured lengths. A concluding discussion explores the ways in which using a robot may be advantageous or disadvantageous, and real-world applications.
In a simulation of potential future space missions to Europa, one of …
In a simulation of potential future space missions to Europa, one of Jupiter’s moons, student teams are challenged to direct a robot placed in an enclosed maze to search for and find the most “alien life.” The robot is equipped with a camera to send a live feed of its surroundings in the maze. Students control the robot from outside the maze by looking at the live feed on a smartphone and using the robot’s remote control, making a map as they go. The student teams compete as if they are space agencies creating their own exploratory systems to meet the challenge’s criteria and constraints and prove “in the field” that they have the best plan to win the mission contract and get the job. This activity simulates the real-world research of scientists and engineers developing a robot with the capabilities to explore under the ice-covered surface of Europa.
This learning video presents an introduction to graph theory through two fun, …
This learning video presents an introduction to graph theory through two fun, puzzle-like problems: ''The Seven Bridges of Konigsberg'' and ''The Chinese Postman Problem''. Any high school student in a college-preparatory math class should be able to participate in this lesson. Materials needed include: pen and paper for the students; if possible, printed-out copies of the graphs and image that are used in the module; and a blackboard or equivalent. During this video lesson, students will learn graph theory by finding a route through a city/town/village without crossing the same path twice. They will also learn to determine the length of the shortest route that covers all the roads in a city/town/village. To achieve these two learning objectives, they will use nodes and arcs to create a graph and represent a real problem.
No restrictions on your remixing, redistributing, or making derivative works. Give credit to the author, as required.
Your remixing, redistributing, or making derivatives works comes with some restrictions, including how it is shared.
Your redistributing comes with some restrictions. Do not remix or make derivative works.
Most restrictive license type. Prohibits most uses, sharing, and any changes.
Copyrighted materials, available under Fair Use and the TEACH Act for US-based educators, or other custom arrangements. Go to the resource provider to see their individual restrictions.