Short explanation with graphical quiz to check understanding, on the changes in …
Short explanation with graphical quiz to check understanding, on the changes in aggregate demand, short run aggregate supply and long run aggregate supply and the things that can change them.
While the heyday of the canals lasted only a few decades, they …
While the heyday of the canals lasted only a few decades, they transformed the American economy by connecting the areas west of the Appalachian Mountains to eastern population centers and Atlantic ports. Concentrated largely north of the Mason-Dixon line, they shaped American regionalism too by linking the northeast and northwest together into a region that increasingly came to see itself as the "North."
There are two types of catalysis reactions: homogeneous and heterogeneous. In a …
There are two types of catalysis reactions: homogeneous and heterogeneous. In a homogeneous reaction, the catalyst is in the same phase as the reactants. In a heterogeneous reaction, the catalyst is in a different phase from the reactants. This activity addresses homogeneous catalysis.
This resource provides statistical data pertaining to state and local law enforcement, …
This resource provides statistical data pertaining to state and local law enforcement, including: personnel, operating expenditures, 9-1-1 participation, computers and information systems, video cameras, police-public contact, and law enforcement training academies.
This resource is a downloadable pdf listing common TCP/UDP ports for a …
This resource is a downloadable pdf listing common TCP/UDP ports for a computer. It is very useful as a quick reference when trying to find a certain port number.
Explore a NetLogo model of populations of rabbits, grass, and weeds. First, …
Explore a NetLogo model of populations of rabbits, grass, and weeds. First, adjust the model to start with a different rabbit population size. Then adjust model variables, such as how fast the plants or weeds grow, to get more grass than weeds. Change the amount of energy the grass or weeds provide to the rabbits and the food preference. Use line graphs to monitor the effects of changes you make to the model, and determine which settings affect the proportion of grass to weeds when rabbits eat both.
This 90-minute activity features six interactive molecular models to explore the relationships …
This 90-minute activity features six interactive molecular models to explore the relationships among voltage, current, and resistance. Students start at the atomic level to explore how voltage and resistance affect the flow of electrons. Next, they use a model to investigate how temperature can affect conductivity and resistivity. Finally, they explore how electricity can be converted to other forms of energy. The activity was developed for introductory physics courses, but the first half could be appropriate for physical science and Physics First. The formula for Ohm's Law is introduced, but calculations are not required. This item is part of the Concord Consortium, a nonprofit research and development organization dedicated to transforming education through technology. The Concord Consortium develops deeply digital learning innovations for science, mathematics, and engineering.
This concept-building activity contains a set of sequenced simulations for investigating how …
This concept-building activity contains a set of sequenced simulations for investigating how atoms can be excited to give off radiation (photons). Students explore 3-dimensional models to learn about the nature of photons as "wave packets" of light, how photons are emitted, and the connection between an atom's electron configuration and how it absorbs light. Registered users are able to use free data capture tools to take snapshots, drag thumbnails, and submit responses. This item is part of the Concord Consortium, a nonprofit research and development organization dedicated to transforming education through technology.
Explore how populations change over time in a NetLogo model of sheep …
Explore how populations change over time in a NetLogo model of sheep and grass. Experiment with the initial number of sheep, the sheep birthrate, the amount of energy sheep gain from the grass, and the rate at which the grass re-grows. Remove sheep that have a particular trait (better teeth) from the population, then watch what happens to the sheep teeth trait in the population as a whole. Consider conflicting selection pressures to make predictions about other instances of natural selection.
Database of a series of statistical indicators, primarily economic, but also social …
Database of a series of statistical indicators, primarily economic, but also social and educational, on each OECD countries. Can be viewed either online or downloaded as excel files. The excel downloads also allow for graphical comparisons with other OECD countries.
This website serves as a clearinghouse of information concerning the ways adolescents …
This website serves as a clearinghouse of information concerning the ways adolescents use and misuse technology. It is intended to be a resource for parents, educators, mental health professionals, law enforcement officers, counselors, and others who work with youth (as well as for youth themselves!). Here you will find facts, figures, and detailed stories from those who have been directly impacted by online aggression. In addition, the site includes numerous resources to help you prevent and respond to cyberbullying incidents. All of the information on this site is informed by over fifteen years of research.
In this activity, students extract DNA from Archaea or from their cheek …
In this activity, students extract DNA from Archaea or from their cheek cells. Students learn key concepts about DNA function during the intervals required for the extraction procedure. Student understanding of DNA structure, function and replication is further developed by additional analysis and discussion questions and hands-on modeling of DNA replication. This activity helps students meet the Next Generation Science Standards.
Explore the relationship between the genetic code on the DNA strand and …
Explore the relationship between the genetic code on the DNA strand and the resulting protein and rudimentary shape it forms. Through models of transcription and translation, you will discover this relationship and the resilience to mutations built into our genetic code. Start by exploring DNA's double helix with an interactive 3D model. Highlight base pairs, look at one or both strands, and turn hydrogen bonds on or off. Next, watch an animation of transcription, which creates RNA from DNA, and translation, which 'reads' the RNA codons to create a protein.
Students are to research a topic and present the topic by either …
Students are to research a topic and present the topic by either trying to convince you one way or another about the topic or leaving you to make your choice.
When school teams use varied data points in conjunction with one another …
When school teams use varied data points in conjunction with one another the information can lead to more effective systems, structures and interventions that will ultimately lead to improved outcomes for students. Teams are encouraged to consider using the Data-Informed Decision-Making Tool and Five Whys when analyzing their data and determining next steps.
The Census Flows Mapper is a web mapping application intended to provide …
The Census Flows Mapper is a web mapping application intended to provide users with a simple interface to view, save and print county-to-county migration flows maps of the United States. The data are from the 2006-2010 American Community Survey.
Data Science is a growing field across all disciplines and grade levels. …
Data Science is a growing field across all disciplines and grade levels. Use the assets in this collection to help learn valuable skills and concepts related to collecting, using, analyzing, and presenting data. The VDOE, Data Science Teachers, and WHRO Education collaboratively created this content.
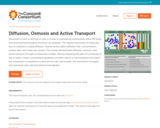
Movement of ions in and out of cells is crucial to maintaining …
Movement of ions in and out of cells is crucial to maintaining homeostasis within the body and ensuring that biological functions run properly. The natural movement of molecules due to collisions is called diffusion. Several factors affect diffusion rate: concentration, surface area, and molecular pumps. This activity demonstrates diffusion, osmosis, and active transport through 12 interactive models.
The most democratic body in the federal government, hundreds of representatives for …
The most democratic body in the federal government, hundreds of representatives for the House are elected every other year. This site maps elections from before the Civil War until today showing changing patterns across regions and between urban and rural areas.
The interactions of electrons with matter have great explanatory power and are …
The interactions of electrons with matter have great explanatory power and are central to many technologies from transistors, diodes, smoke detectors, and dosemeters to sophisticated imaging, lasers, and quantum computing. A conceptual grasp of the interactions of electrons in general allows students to acquire deeper understanding that can be applied to a very broad range of technologies.
No restrictions on your remixing, redistributing, or making derivative works. Give credit to the author, as required.
Your remixing, redistributing, or making derivatives works comes with some restrictions, including how it is shared.
Your redistributing comes with some restrictions. Do not remix or make derivative works.
Most restrictive license type. Prohibits most uses, sharing, and any changes.
Copyrighted materials, available under Fair Use and the TEACH Act for US-based educators, or other custom arrangements. Go to the resource provider to see their individual restrictions.