Updating search results...

Search Resources

18 Results

View
Selected filters:
  • network
Being Online
Unrestricted Use
CC BY
Rating
0.0 stars

This is a slide show is intended to introduce students to networks, LAN, WAN, and WWW. 

Subject:
Networking and the Internet
Material Type:
Activity/Lab
Author:
Jude Raffeinner
Date Added:
12/30/2021
Complex Networks and Graphs
Read the Fine Print
Educational Use
Rating
0.0 stars

Students learn about complex networks and how to represent them using graphs. They also learn that graph theory is a useful mathematical tool for studying complex networks in diverse applications of science and engineering, such as neural networks in the brain, biochemical reaction networks in cells, communication networks, such as the internet, and social networks. Topics covered include set theory, defining a graph, as well as defining the degree of a node and the degree distribution of a graph.

Subject:
Science
Scientific and Engineering Practices
Material Type:
Lesson Plan
Provider:
TeachEngineering
Provider Set:
TeachEngineering
Author:
Debbie Jenkinson
Garrett Jenkinson
John Goutsias
Susan Frennesson
Date Added:
09/18/2014
Computer Network Terms Study Set #1
Conditional Remix & Share Permitted
CC BY-NC-SA
Rating
0.0 stars

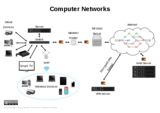
A Quizlet study set of 15 Computer Network terms and definitions. This is a study set with terms and definitions done on quizlet. It covers basic terms, as well as topogolies, and Ethernet cable types.This set can be used as reinforcement of these topics or as a short quiz to test understanding.
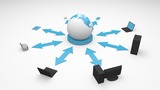
Subject:
Computer Science
Networking and the Internet
Material Type:
Activity/Lab
Assessment
Homework/Assignment
Author:
Ronald Sparks
Date Added:
06/05/2022
Curb the Epidemic!
Read the Fine Print
Educational Use
Rating
0.0 stars

Using a website simulation tool, students build on their understanding of random processes on networks to interact with the graph of a social network of individuals and simulate the spread of a disease. They decide which two individuals on the network are the best to vaccinate in an attempt to minimize the number of people infected and "curb the epidemic." Since the results are random, they run multiple simulations and compute the average number of infected individuals before analyzing the results and assessing the effectiveness of their vaccination strategies.

Subject:
Science
Scientific and Engineering Practices
Material Type:
Activity/Lab
Provider:
TeachEngineering
Provider Set:
TeachEngineering
Author:
Debbie Jenkinson
Garrett Jenkinson
John Goutsias
Susan Frennesson
Date Added:
09/18/2014
Graph Theory in Drama
Read the Fine Print
Educational Use
Rating
0.0 stars

Students use graph theory to create social graphs for their own social networks and apply what learn to create a graph representing the social dynamics found in a dramatic text. Students then derive meaning based on what they know about the text from the graphs they created. Students learn graph theory vocabulary, as well as engineering applications of graph theory.

Subject:
Science
Scientific and Engineering Practices
Material Type:
Lesson Plan
Provider:
TeachEngineering
Provider Set:
TeachEngineering
Author:
Brian Sandall
Ramsey Young
Date Added:
09/18/2014
Graphing Your Social Network
Read the Fine Print
Educational Use
Rating
0.0 stars

Students analyze their social networks using graph theory. They gather data on their own social relationships, either from Facebook interactions or the interactions they have throughout the course of a day, recording it in Microsoft Excel and using Cytoscape (a free, downloadable application) to generate social network graphs that visually illustrate the key persons (nodes) and connections between them (edges). The nodes in the Cytoscape graphs are color-coded and sized according to the importance of the node (in this activity, nodes are people in students' social networks). After the analysis, the graphs are further examined to see what can be learned from the visual representation. Students gain practice with graph theory vocabulary, including node, edge, betweeness centrality and degree on interaction, and learn about a range of engineering applications of graph theory.

Subject:
Science
Scientific and Engineering Practices
Material Type:
Activity/Lab
Provider:
TeachEngineering
Provider Set:
TeachEngineering
Author:
Brian Sandall
Ramsey Young
Date Added:
09/18/2014
Graphing the Spread of Disease
Read the Fine Print
Educational Use
Rating
0.0 stars

Students simulate disease transmission by collecting data based on their proximity to other students. One option for measuring proximity is by having Bluetooth devices "discover" each other. After data is collected, students apply graph theory to analyze it, and summarize their data and findings in lab report format. Students learn real-world engineering applications of graph theory and see how numerous instances of real-world relationships can be more thoroughly understood by applying graph theory. Also, by applying graph theory the students are able to come up with possible solutions to limit the spread of disease. The activity is intended to be part of a computer science curriculum and knowledge of the Java programming language is required. To complete the activity, a computer with Java installed and appropriate editing software is needed.

Subject:
Science
Scientific and Engineering Practices
Material Type:
Activity/Lab
Provider:
TeachEngineering
Provider Set:
TeachEngineering
Author:
Brian Sandall
Steve Hamersky
Date Added:
09/18/2014
It's a Connected World: The Beauty of Network Science
Read the Fine Print
Educational Use
Rating
0.0 stars

Students learn about complex networks and how to use graphs to represent them. They also learn that graph theory is a useful part of mathematics for studying complex networks in diverse applications of science and engineering, including neural networks in the brain, biochemical reaction networks in cells, communication networks, such as the internet, and social networks. Students are also introduced to random processes on networks. An illustrative example shows how a random process can be used to represent the spread of an infectious disease, such as the flu, on a social network of students, and demonstrates how scientists and engineers use mathematics and computers to model and simulate random processes on complex networks for the purposes of learning more about our world and creating solutions to improve our health, happiness and safety.

Subject:
Science
Scientific and Engineering Practices
Material Type:
Unit of Study
Provider:
TeachEngineering
Provider Set:
TeachEngineering
Author:
Debbie Jenkinson
Garrett Jenkinson
John Goutsias
Susan Frennesson
Date Added:
09/18/2014
LAN vs WAN VACS 5.17
Rating
0.0 stars

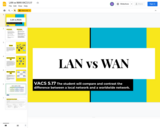
These slide help to decipher between and explain Local Area Networks and Wide Are Networks. The teacher can use the slides to explain and then print the slides with pictures to display in the room as a reminder.
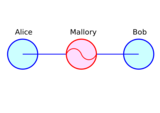
Subject:
Computer Science
Networking and the Internet
Material Type:
Lecture Notes
Author:
Anna Nester
Date Added:
02/10/2022
Making the Connection
Read the Fine Print
Educational Use
Rating
0.0 stars

Graph theory is a visual way to represent relationships between objects. One of the simplest uses of graph theory is a family tree that shows how different people are related. Another application is social networks like Facebook, where a network of "friends" and their "friends" can be represented using graphs. Students learn and apply concepts and methods of graph theory to analyze data for different relationships such as friendships and physical proximity. They are asked about relationships between people and how those relationships can be illustrated. As part of the lesson, students are challenged to find the social graph of their friends. This prepares students for the associated activity during which they simulate and analyze the spread of disease using graph theory by assuming close proximity to an infected individual causes the disease to spread.

Subject:
Science
Scientific and Engineering Practices
Material Type:
Lesson Plan
Provider:
TeachEngineering
Provider Set:
TeachEngineering
Author:
Brian Sandall
Steve Hamersky
Date Added:
09/18/2014
Processes on Complex Networks
Read the Fine Print
Educational Use
Rating
0.0 stars

Building on their understanding of graphs, students are introduced to random processes on networks. They walk through an illustrative example to see how a random process can be used to represent the spread of an infectious disease, such as the flu, on a social network of students. This demonstrates how scientists and engineers use mathematics to model and simulate random processes on complex networks. Topics covered include random processes and modeling disease spread, specifically the SIR (susceptible, infectious, resistant) model.

Subject:
Science
Scientific and Engineering Practices
Material Type:
Lesson Plan
Provider:
TeachEngineering
Provider Set:
TeachEngineering
Author:
Debbie Jenkinson
Garrett Jenkinson
John Goutsias
Susan Frennesson
Date Added:
09/18/2014
Start Networking!
Read the Fine Print
Educational Use
Rating
0.0 stars

To get a better understanding of complex networks, students create their own, real social network example by interacting with their peers in the classroom and documenting the interactions. They represent the interaction data as a graph, calculate two mathematical quantities associated with the graph—the degree of each node and the degree distribution of the graph—and analyze how these quantities can be used to infer properties of the social network at hand.

Subject:
Science
Scientific and Engineering Practices
Material Type:
Activity/Lab
Provider:
TeachEngineering
Provider Set:
TeachEngineering
Author:
Debbie Jenkinson
Garrett Jenkinson
John Goutsias
Susan Frennesson
Date Added:
09/18/2014
The Underground Railroad and the Fugitive Slave Act of 1850
Unrestricted Use
CC BY
Rating
0.0 stars

This collection uses primary sources to explore the Underground Railroad and the Fugitive Slave Act of 1850. Digital Public Library of America Primary Source Sets are designed to help students develop their critical thinking skills and draw diverse material from libraries, archives, and museums across the United States. Each set includes an overview, ten to fifteen primary sources, links to related resources, and a teaching guide. These sets were created and reviewed by the teachers on the DPLA's Education Advisory Committee.

Subject:
American History
History/Social Sciences
Material Type:
Primary Source
Provider:
Digital Public Library of America
Author:
Lakisha Odlum
Date Added:
04/11/2016
Using Graph Theory to Analyze Drama
Read the Fine Print
Educational Use
Rating
0.0 stars

Students analyze dramatic works using graph theory. They gather data, record it in Microsoft Excel and use Cytoscape (a free, downloadable application) to generate graphs that visually illustrate the key characters (nodes) and connections between them (edges). The nodes in the Cytoscape graphs are color-coded and sized according to the importance of the node (in this activity nodes represent characters in the work and their relative importance to the story). After the analysis, the graphs are further examined to see what the visual depiction of the story in the form of a graph tells readers about the inner workings of the dramatic work. Students gain practice with graph theory vocabulary, including node, edge, betweeness centrality and degree on interaction, and learn about a range of engineering applications of graph theory.

Subject:
Science
Scientific and Engineering Practices
Material Type:
Activity/Lab
Provider:
TeachEngineering
Provider Set:
TeachEngineering
Author:
Brian Sandall
Ramsey Young
Date Added:
09/18/2014
What is a Network?
Unrestricted Use
CC BY
Rating
0.0 stars

This is a slide presentation and reinforcing paper/pencil activity designed to introduce students to:NetworkLANWANInternet

Subject:
Computer Science
Material Type:
Activity/Lab
Author:
Jude Raffeinner
Date Added:
05/06/2022