Slope Discovery Power Point Activity by C. Hogan Virginia Department of Education …
Slope Discovery Power Point Activity by C. Hogan Virginia Department of Education resource titled, "Slope Discovery," which is an activity resource in which the student will determine slope, write the equation in slope-intercept form, and graph a line.
This task requires students to use the fact that on the graph …
This task requires students to use the fact that on the graph of the linear function h(x)=ax+b, the y-coordinate increases by a when x increases by one. Specific values for a and b were left out intentionally to encourage students to use the above fact as opposed to computing the point of intersection, (p,q), and then computing respective function values to answer the question. The Virginia Department of Education resource titled, "Graphing Linear Functions," which requires students to graph equations in y=mx + b form includes a template and lesson plan.
In this task, we are given the graph of two lines including …
In this task, we are given the graph of two lines including the coordinates of the intersection point and the coordinates of the two vertical intercepts, and are asked for the corresponding equations of the lines. It is a very straightforward task that connects graphs and equations and solutions and intersection points. The students will use a VDOE resource to recognize and describe the graph of a linear function (foldables, bingo game, lesson plan for the teacher).
This is a task from the Illustrative Mathematics website that is one …
This is a task from the Illustrative Mathematics website that is one part of a complete illustration of the standard to which it is aligned. Each task has at least one solution and some commentary that addresses important aspects of the task and its potential use. The Virginia Department of Education Resource titled, "Telling the Tale," walks students through a real world exercise analyzing a linear relationship.
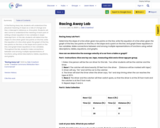
In the Racing Away lab, students will understand the physical meaning of …
In the Racing Away lab, students will understand the physical meaning of slope as a rate of change and the y-intercept in distance vs. time plots. Students will also come to understand the meaning of each part of writing a linear equation in two variables in slope-intercept form.
In this lab, students will determine the slope of a line when given two points on the line; write the equation of a line when given the graph of the line, two points on the line, or the slope and a point on the line; and graph linear equations in two variables. Throughout the lab, students make connections between and among multiple representations of functions using verbal descriptions, tables, equations, and graphs.
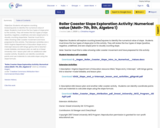
Objective: Students will explore counting boxes/squares to identify the numerical value of …
Objective: Students will explore counting boxes/squares to identify the numerical value of slope. Students must know the four types of slope prior to this activity. They will review the four types of slope (positive, negative, undefined, and zero slope) prior to visually counting slope.Note: Teacher must find a video showing roller coaster movement and have prepared for this activity. The Extension activities are a VDOE Virginia Department of Education Slope and y-intercept resource with bingo game, link to teacher-made foldable, and lesson plan as well as a Drexel University mini- lesson plan with an additional roller coaster activity. Students can identify coordinate points and use materials to calculate slope using the slope formula.
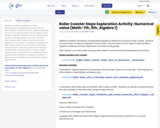
Khan Academy is a free website. Teachers can create classes and assign …
Khan Academy is a free website. Teachers can create classes and assign practice problems to students. This resource has listed 8th grade math VA standards that align to the functions and slope-intercept topics.
Khan Academy is a free website. Teachers can create classes and assign …
Khan Academy is a free website. Teachers can create classes and assign practice problems to students. This resource has listed 8th grade math VA standards that align to the functions and slope-intercept topics.
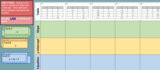
In this self-checking activity, students will match 18 cards, identifying the slope, y-intercept, …
In this self-checking activity, students will match 18 cards, identifying the slope, y-intercept, and slope-intercept form of each equation to match each of the six tables.
In this Desmos activity, students practice defining slope and y-intercept given a …
In this Desmos activity, students practice defining slope and y-intercept given a real world scenario. Students complete a table and write an equation in the form of y=mx+b for multiple similar situations.
No restrictions on your remixing, redistributing, or making derivative works. Give credit to the author, as required.
Your remixing, redistributing, or making derivatives works comes with some restrictions, including how it is shared.
Your redistributing comes with some restrictions. Do not remix or make derivative works.
Most restrictive license type. Prohibits most uses, sharing, and any changes.
Copyrighted materials, available under Fair Use and the TEACH Act for US-based educators, or other custom arrangements. Go to the resource provider to see their individual restrictions.