Map of Europe color coded by infant mortality rate broken down by …
Map of Europe color coded by infant mortality rate broken down by nation or subnational units (akin to US states or Canadian provinces). Shows the international differences, but also shows the (less substantial) differences within nations. The categories for the color coding have been changed from the international standards to differentiate among the universally low infant mortality rates across Europe.
The microscopic world is full of phenomena very different from what we …
The microscopic world is full of phenomena very different from what we see in everyday life. Some of those phenomena can only be explained using quantum mechanics. This activity introduces basic quantum mechanics concepts about electrons that are essential to understanding modern and future technology, especially nanotechnology. Start by exploring probability distribution, then discover the behavior of electrons with a series of simulations.
Students will analyze data from the "State of the Bay" reports from …
Students will analyze data from the "State of the Bay" reports from the Chesapeake Bay Foundation while reviewing and completing the scientific method. The final assessment is a mission for students to create a persuasive speech or advertisement that will call for action to make changes that will positively impact the watershed with reasons why change is important.
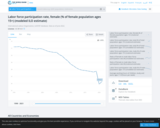
Data set and map pertaining to labor force participation rates for women …
Data set and map pertaining to labor force participation rates for women in all countries. The World Bank specifies female labor force participation as a World Development Indicator (WDI) -- the statistical benchmark that helps measure the progress of development.
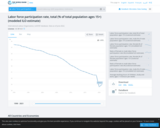
Data set and map pertaining to total labor force participation rates for …
Data set and map pertaining to total labor force participation rates for all countries. The World Bank specifies labor force participation as a World Development Indicator (WDI) -- the statistical benchmark that helps measure the progress of development.
Isaac Newton's famous thought experiment about what would happen if you launched …
Isaac Newton's famous thought experiment about what would happen if you launched a cannon from a mountaintop at a high velocity comes to life with an interactive computer model. You are charged with the task of launching a satellite into space. Control the angle and speed at which the satellite is launched, and see the results to gain a basic understanding of escape velocity.
Like so many other government agencies during the New Deal, HOLC and …
Like so many other government agencies during the New Deal, HOLC and its parent bureau, the Federal Home Loan Bank Board, shaped Americans' lives and livelihoods profoundly during and after the Great Depression of the 1930s. Both proved critical to protecting and expanding home ownership, to standardizing lending practices, and to encouraging residential and commercial real estate investment in a flagging economy. Across the middle third of the twentieth century, arguably the most prosperous decades in American history, these agencies worked with public and private sector partners to create millions of jobs and help millions of Americans buy or keep their homes. At the very same time, federal housing programs helped codify and expand practices of racial and class segregation. They ensured, moreover, that rampant real estate speculation and environmental degradation would accompany America's remarkable economic recovery and growth.
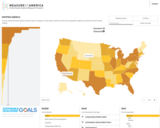
Map showing America broken down by various measures of standard of living, …
Map showing America broken down by various measures of standard of living, environmental impact, demographics and crime. Focuses on applying the Human Development Index -- the major measure of international development -- to inequalities within in the United States.
Meiosis is the process by which gametes (eggs and sperm) are made. …
Meiosis is the process by which gametes (eggs and sperm) are made. Gametes have only one set of chromosomes. Therefore, meiosis involves a reduction in the amount of genetic material. Each gamete has only half the chromosomes of the original germ cell. Explore meiosis with a computer model of dragons. Run meiosis, inspect the chromosomes, then choose gametes to fertilize. Predict the results of the dragon offspring and try to make a dragon without legs. Learn why all siblings do not look alike.
This initial module from the GENIQUEST project introduces the dragons and the …
This initial module from the GENIQUEST project introduces the dragons and the inheritance of their traits, then delves into meiosis and its relationship to inherited traits. Students examine the effects of choosing different gametes on dragon offspring, and learn about genetic recombination by creating recombination events to generate specific offspring from two given parent dragons. Students learn about inbred strains and breed an inbred strain of dragons themselves.
In this activity, students interact with 12 models to observe emergent phenomena …
In this activity, students interact with 12 models to observe emergent phenomena as molecules assemble themselves. Investigate the factors that are important to self-assembly, including shape and polarity. Try to assemble a monolayer by "pushing" the molecules to the substrate (it's not easy!). Rotate complex molecules to view their structure. Finally, create your own nanostructures by selecting molecules, adding charges to them, and observing the results of self-assembly.
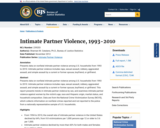
The survey was designed to obtain national benchmarks on a wide range …
The survey was designed to obtain national benchmarks on a wide range of health issues, and to enable changes in health to be monitored over time. Information was collected about: the health status of the population; health-related aspects of lifestyle and other health risk factors; and the use of health services and other actions people had recently taken for their health."
No restrictions on your remixing, redistributing, or making derivative works. Give credit to the author, as required.
Your remixing, redistributing, or making derivatives works comes with some restrictions, including how it is shared.
Your redistributing comes with some restrictions. Do not remix or make derivative works.
Most restrictive license type. Prohibits most uses, sharing, and any changes.
Copyrighted materials, available under Fair Use and the TEACH Act for US-based educators, or other custom arrangements. Go to the resource provider to see their individual restrictions.