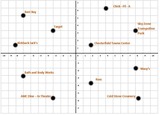
Jamboard of Coordinate Plane. Drag and drop to label the coordinate plane. …
Jamboard of Coordinate Plane. Drag and drop to label the coordinate plane. Go to second slide and drag and drop the ordered pairs with the quadrants or axis.
Students will identify the parts of the coordinate plane and graph ordered …
Students will identify the parts of the coordinate plane and graph ordered pairs in all four quadrants of the coordinate plane. There are strategies embedded within the handout to support an enduring understanding. For example, in order to plot points, you can use an Elevator relation: Choose the door "x", then the floor "y") Extension: Virginia Department of Education resource document titled, "Coordinate Plane", which is a remediation lesson. Students identify, and graph ordered pairs in the four quadrants of a coordinate plane. Visual aid handout, exit ticket, and lesson plan are included.
In this 40-day module, students develop a coordinate system for the first …
In this 40-day module, students develop a coordinate system for the first quadrant of the coordinate plane and use it to solve problems. Students use the familiar number line as an introduction to the idea of a coordinate, and they construct two perpendicular number lines to create a coordinate system on the plane. Students see that just as points on the line can be located by their distance from 0, the plane's coordinate system can be used to locate and plot points using two coordinates. They then use the coordinate system to explore relationships between points, ordered pairs, patterns, lines and, more abstractly, the rules that generate them. This study culminates in an exploration of the coordinate plane in real world applications. VDOE supported resource guides students through identifying coordinates and plotting points.
In Unit 7, the final unit of the year for Grade 5, …
In Unit 7, the final unit of the year for Grade 5, students are introduced to the coordinate plane and use it to represent the location of objects in space, as well as to represent patterns and real-world situations.
Students have coordinated numbers and distance before, namely with number lines. Students were introduced to number lines with whole-number intervals in Grade 2 and used them to solve addition and subtraction problems, helping to make the connection between quantity and distance (2.MD.5—6). Then in Grade 3, students made number lines with fractional intervals, using them to understand the idea of equivalence and comparison of fractions, again connecting this to the idea of distance (3.NF.2). For example, two fractions that were at the same point on a number line were equivalent, while a fraction that was further from 0 than another was greater. Then, in Grade 4, students learned to add, subtract, and multiply fractions in simple cases using the number line as a representation, and they extended it to all cases, including in simple cases involving fraction division, throughout Grade 5 (5.NF.1—7). Students’ preparation for this unit is also connected to their extensive pattern work, beginning in Kindergarten with patterns in counting sequences (K.CC.4c) and extending through Grade 4 work with generating and analyzing a number or shape pattern given its rule (4.OA.3).
Thus, students start the unit thinking about the number line as a way to represent distance in one dimension and then see the usefulness of a perpendicular line segment to define distance in a second dimension, allowing any point in two-dimensional space to be located easily and precisely (MP.6). After a lot of practice identifying the coordinates of points as well as plotting points given their coordinates with coordinate grids of various intervals and scales, students begin to draw lines and figures on a coordinate grid, noticing simple patterns in their coordinates. Then, after students have grown comfortable with the coordinate plane as a way to represent two-dimensional space, they represent real-world and mathematical situations, as well as two numerical patterns, by graphing their coordinates. This visual representation allows for a rich interpretation of these contexts (MP.2, MP.4).
This is a task from the Illustrative Mathematics website that is one …
This is a task from the Illustrative Mathematics website that is one part of a complete illustration of the standard to which it is aligned. Each task has at least one solution and some commentary that addresses important aspects of the task and its potential use. An additional source is added from VDOE to provide a foundation for identifying polygons and other support related to working with polygons.
Objective: Students will explore counting boxes/squares to identify the numerical value of …
Objective: Students will explore counting boxes/squares to identify the numerical value of slope. Students must know the four types of slope prior to this activity. They will review the four types of slope (positive, negative, undefined, and zero slope) prior to visually counting slope.Note: Teacher must find a video showing roller coaster movement and have prepared for this activity. The Extension activities are a VDOE Virginia Department of Education Slope and y-intercept resource with bingo game, link to teacher-made foldable, and lesson plan as well as a Drexel University mini- lesson plan with an additional roller coaster activity. Students can identify coordinate points and use materials to calculate slope using the slope formula.
The mini lesson consists of a presentation of slides of transformations of …
The mini lesson consists of a presentation of slides of transformations of translation, reflections, and rotations. Students will decide which slide and use a text box to type the answer per slide.
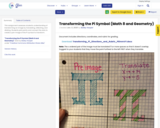
This assignment assesses students understanding of transforming an image by translating, reflecting, …
This assignment assesses students understanding of transforming an image by translating, reflecting, and dilating. Students plot points and connect the dots to create a pre-image of the Pi symbol to transform.
No restrictions on your remixing, redistributing, or making derivative works. Give credit to the author, as required.
Your remixing, redistributing, or making derivatives works comes with some restrictions, including how it is shared.
Your redistributing comes with some restrictions. Do not remix or make derivative works.
Most restrictive license type. Prohibits most uses, sharing, and any changes.
Copyrighted materials, available under Fair Use and the TEACH Act for US-based educators, or other custom arrangements. Go to the resource provider to see their individual restrictions.