Students are to research a topic and present the topic by either …
Students are to research a topic and present the topic by either trying to convince you one way or another about the topic or leaving you to make your choice.
The student will use a table of personal data collected about plugged/unplugged …
The student will use a table of personal data collected about plugged/unplugged activites and times of rest throughout the period of one week (7 days) to document screen times in comparison to active and restful breaks for a computer science integration and digital balance project.This Part 1 activity uses the data collected in a table to teach students how to copy and paste a table from Docs into Slides, and how to develop a Slideshow Presentation with tables (Part 1) and graphs (Part 2). Students are given opportunities to collect and analyze data, to enter information into tables and graphs, to develop and share presentations in Slides, as well as summarize and draw conclusions about the data collection, graphing, and results as comparable to their peers, digital categories, or peer groups (Gamers vs YouTubers, Boys vs Girls, etc.).The goal/s of this unit is to help students realize the importance of living a digitally balanced life and to help students develop skills for creating and using digital tables and graphs with an introduction to data collection and analysis.
The student will use previously collected personal and peer data (Part 1: …
The student will use previously collected personal and peer data (Part 1: Screen Time Logs) to graph a bar and pie graph in Slides using Sheets to graph the data collected.This is the second part of an intended presentation project for a computer CTE middle school class, but can be edited and adapted for any graphing and/or computer integration lessons about bar and pie graphs and how to make them in Google Sheets using Google Slides.
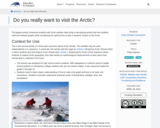
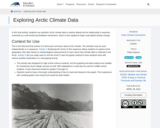
This jigsaw activity introduces students with Arctic weather data using a role-playing …
This jigsaw activity introduces students with Arctic weather data using a role-playing activity that has students read and interpret graphs while considering the optimal time to plan a research mission to the Arctic.
Three easily applied exit ticket examples that can be easily implemented for …
Three easily applied exit ticket examples that can be easily implemented for ANY lesson (elementary - high). Simple way to collect data and measure student learning!
In this activity, students use authentic Arctic climate data to explore albedo …
In this activity, students use authentic Arctic climate data to explore albedo and its relationship to seasonal snowmelt as a self-reinforcing feedback mechanism, which is then applied to large scale global climate change.
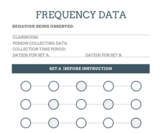
This tool is a simple way to collect some data on the …
This tool is a simple way to collect some data on the frequency of a desired or undesired behavior prior to a lesson or intervention. For example, if a teacher shares that calling out is a major concern you could observe a lesson for 30 minutes and record the number of times students call out during that time (by putting a check mark in a circle). Then after delivering instruction on the importance of being respectful and not interupting instruction do an observation for the same time period and see if there was improvement!NOTE: You could also as a teacher to collect the data for you!
Students participating in Storm Signals play a critical role in the overall …
Students participating in Storm Signals play a critical role in the overall process of the Student Observation Network (S.O.N.). They are able to confirm the predictions of the Sunspotter's Sunspot Suspect, and they will predict magnetic storms around Earth, issuing Space Weather alerts that tell other students to begin monitoring the Magnetosphere for magnetic storms. By collecting and analyzing real-time data from their radio antennas, professional observatories, and NASA satellites, they can carry out the same duties as NASA researchers! The Space Weather alerts issued by the Space Environment Center (SEC) of NOAA (National Oceanographic and Atmospheric Administration) are essential to protect satellites, power grids and astronauts.
In Storm Signals you will learn:
1. How to instruct students in the construction of a simple device to detect radio emissions from the Sun.
2. How to enable students to obtain and interpret radio emissions from ground-based professional observatories.
3. How to enable students to obtain and interpret radio, x-ray and ultraviolet emissions from NASA satellites.
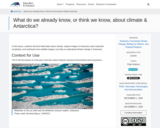
In this lesson, students will first participate in a chalk talk to …
In this lesson, students will first participate in a chalk talk to elicit initial ideas about climate and Antarctica and the types of data scientists collect. Next, they will explore images of Antarctica and make initial noticings and wonderings about what they���re seeing. Students will be introduced to important vocabulary through matching terms to components or features of a satellite image. Finally, students will synthesize their initial ideas about how satellite imagery can help us understand climate change in Antarctica. This is the first lesson of a five-part curriculum about Antarctic physical environments and ecosystems.
No restrictions on your remixing, redistributing, or making derivative works. Give credit to the author, as required.
Your remixing, redistributing, or making derivatives works comes with some restrictions, including how it is shared.
Your redistributing comes with some restrictions. Do not remix or make derivative works.
Most restrictive license type. Prohibits most uses, sharing, and any changes.
Copyrighted materials, available under Fair Use and the TEACH Act for US-based educators, or other custom arrangements. Go to the resource provider to see their individual restrictions.