The student will use a table of personal data collected about plugged/unplugged …
The student will use a table of personal data collected about plugged/unplugged activites and times of rest throughout the period of one week (7 days) to document screen times in comparison to active and restful breaks for a computer science integration and digital balance project.This Part 1 activity uses the data collected in a table to teach students how to copy and paste a table from Docs into Slides, and how to develop a Slideshow Presentation with tables (Part 1) and graphs (Part 2). Students are given opportunities to collect and analyze data, to enter information into tables and graphs, to develop and share presentations in Slides, as well as summarize and draw conclusions about the data collection, graphing, and results as comparable to their peers, digital categories, or peer groups (Gamers vs YouTubers, Boys vs Girls, etc.).The goal/s of this unit is to help students realize the importance of living a digitally balanced life and to help students develop skills for creating and using digital tables and graphs with an introduction to data collection and analysis.
The student will use previously collected personal and peer data (Part 1: …
The student will use previously collected personal and peer data (Part 1: Screen Time Logs) to graph a bar and pie graph in Slides using Sheets to graph the data collected.This is the second part of an intended presentation project for a computer CTE middle school class, but can be edited and adapted for any graphing and/or computer integration lessons about bar and pie graphs and how to make them in Google Sheets using Google Slides.
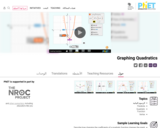
Learn about graphing polynomials. The shape of the curve changes as the …
Learn about graphing polynomials. The shape of the curve changes as the constants are adjusted. View the curves for the individual terms (e.g. y=bx ) to see how they add to generate the polynomial curve.
Build a gene network! The lac operon is a set of genes …
Build a gene network! The lac operon is a set of genes which are responsible for the metabolism of lactose in some bacterial cells. Explore the effects of mutations within the lac operon by adding or removing genes from the DNA.
This is an exploratory activity. Students should have some prior knowledge of …
This is an exploratory activity. Students should have some prior knowledge of evaluating functions for given domain inputs using function notation.This lesson will walk students through using a table and plotting points. By the end of the lesson students should walk away understanding that a line is infinitely many points.
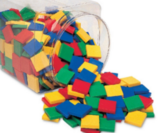
This google slides activity will assist students in making connections with proportional …
This google slides activity will assist students in making connections with proportional reasoning. Students will create tables, equivalent ratios, and graph friendly scenarios. Draggable objects are available for students who need manipulatives to figure it out.
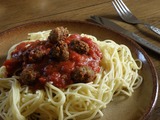
The book Spaghetti and Meatballs for all by Marilyn Burns is a …
The book Spaghetti and Meatballs for all by Marilyn Burns is a mathematical fictional story about Mr. and Mrs. Comfort who are planning to throw a family reunion dinner and the family has to figure out how they can use eight tables and 32 chairs to accommodate all guests. Students dive deeper as they learn about the concept of area and perimeter through cooperative group learning and literacy.
No restrictions on your remixing, redistributing, or making derivative works. Give credit to the author, as required.
Your remixing, redistributing, or making derivatives works comes with some restrictions, including how it is shared.
Your redistributing comes with some restrictions. Do not remix or make derivative works.
Most restrictive license type. Prohibits most uses, sharing, and any changes.
Copyrighted materials, available under Fair Use and the TEACH Act for US-based educators, or other custom arrangements. Go to the resource provider to see their individual restrictions.