Description: Many people love roller coasters, but a portion of the population …
Description: Many people love roller coasters, but a portion of the population might prefer a slower, calmer ride experience. Busch Gardens, a popular theme park in Williamsburg wants to offer a variety of rides that appeal to all ages and abilities. Can you help them design and create a roller coaster that will move at a much slower pace than the typical roller coaster? You will present your prototype in the form of a marble run built on the provided surface. Think about the marble runs that you may have played with or built when you were younger. Can you redesign a marble run that will take the marble the longest amount of time possible to reach the end without stopping? At the conclusion, each group will test and time their marble runs.
Mic Drop Maths is a mathematics podcast for 5th graders based on …
Mic Drop Maths is a mathematics podcast for 5th graders based on the VA Standards of Learning. Each episode addresses one standard and is broken into segments including concept, real-world application, math history, literature connections, misconceptions, and more! There is music, sound effects, jokes, and student voice in each engaging and entertaining episode.
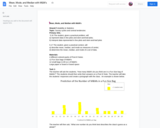
This resource involves students completing a series of four graphs representing how …
This resource involves students completing a series of four graphs representing how many M&M's they predict are in fun size and small bags of M&M's, and the actual number that are present. After collecting data and graphing the results, students will place the data on stem and leaf plots. Next, students will determine the mean, mode, and median for each set of data, and decide which measure of center is most accurate for describing the number of M&M's in the bag. Lastly, students will compare the amount of M&Ms in the fun size bag to those in the small bag.
No restrictions on your remixing, redistributing, or making derivative works. Give credit to the author, as required.
Your remixing, redistributing, or making derivatives works comes with some restrictions, including how it is shared.
Your redistributing comes with some restrictions. Do not remix or make derivative works.
Most restrictive license type. Prohibits most uses, sharing, and any changes.
Copyrighted materials, available under Fair Use and the TEACH Act for US-based educators, or other custom arrangements. Go to the resource provider to see their individual restrictions.