This resource consists of a Java applet and expository text. The applet …
This resource consists of a Java applet and expository text. The applet simulates the time of the k'th arrival in a Poisson process. The arrival number k and the rate of the Poisson process can be varied. The applet illustrates the gamma distribution and a special case of the central limit theorem.
This video is part of the Learn and Grow with WHRO TV …
This video is part of the Learn and Grow with WHRO TV series. Watch Xenia Clare teach about interpreting and analyzing data on a bar graph and pictograph.
Analyzing data displayed in graphsMathematics Instructional Plans (MIPs) help teachers align instruction …
Analyzing data displayed in graphsMathematics Instructional Plans (MIPs) help teachers align instruction with the Mathematics Standards of Learning (SOL) by providing examples of how the knowledge, skills and processes found in the SOL and curriculum framework can be presented to students in the classroom.
In this performance task, students consider two scenarios in a card game …
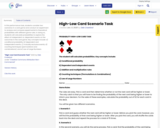
In this performance task, students consider two scenarios in a card game and conduct an experiment to analyze and compare experimental to theoretical probabilities with different game rules. In doing so, students will calculate probabilities to explore the effect of independent vs. dependent events on the outcomes in the card game.
Key concepts include: a) conditional probability; b) dependent and independent events; c) mutually exclusive events; d) counting techniques (permutations and combinations); and e) Law of Large Numbers.
This is a two lesson resource which introduces students to line plots, …
This is a two lesson resource which introduces students to line plots, frequency tables and histograms. In these lessons students both construct and interpret.
Constructing sample spaces and determining the probability of outcomes Mathematics Instructional Plans …
Constructing sample spaces and determining the probability of outcomes Mathematics Instructional Plans (MIPs) help teachers align instruction with the Mathematics Standards of Learning (SOL) by providing examples of how the knowledge, skills and processes found in the SOL and curriculum framework can be presented to students in the classroom.
This resource consists of a Java applet and expository text. The applet …
This resource consists of a Java applet and expository text. The applet allows the user to construct a histogram by clicking on a number line to generate the sample data. The class width can be varied and various summary statistics can be displayed.
This resource consists of a Java applet and expository text. The applet …
This resource consists of a Java applet and expository text. The applet allows the user to construct a histogram by clicking on a number line to generate the sample data. The graph of an error function is shown, either mean square error or mean absolute error.
This resource consists of a Java applet and expository text. The applet …
This resource consists of a Java applet and expository text. The applet allows the user to construct a scatterplot by clicking on a graph to generate the bivariate data. The means, standard deviations, correlation, and the regression line are shown.
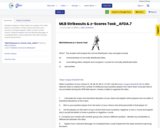
Students research online data from players from MLB teams in a position …
Students research online data from players from MLB teams in a position of their choice and then use z-scores to compare players within a team of their choice. Students explain how the General Manager of a baseball team could implement this data towards improving the team.
This resource consists of a Java applet and expository text. The applet …
This resource consists of a Java applet and expository text. The applet is a simulation of the matching experiment, which consists of a random permutation of the first n positive integers. The random variable of interest is the number of matches (the number of integers in the random permutation that are in their correct positions). The applet illustrates the distribution of the number of matches and the convergence to the Poisson distribution.
Constructing and using circle graphs Mathematics Instructional Plans (MIPs) help teachers align instruction …
Constructing and using circle graphs Mathematics Instructional Plans (MIPs) help teachers align instruction with the Mathematics Standards of Learning (SOL) by providing examples of how the knowledge, skills and processes found in the SOL and curriculum framework can be presented to students in the classroom.
Mic Drop Maths is a mathematics podcast for 5th graders based on …
Mic Drop Maths is a mathematics podcast for 5th graders based on the VA Standards of Learning. Each episode addresses one standard and is broken into segments including concept, real-world application, math history, literature connections, misconceptions, and more! There is music, sound effects, jokes, and student voice in each engaging and entertaining episode.
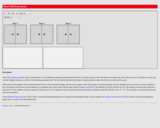
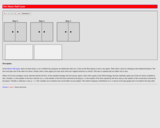
This resource consists of a Java applet and expository text. The applet …
This resource consists of a Java applet and expository text. The applet is a simulation of the Monty Hall experiment: a car is behind one door, goats are behind the other two doors. The player chooses a door and then the host opens another door. The player is given the option of switching to the remaining door. The stochastic behavior of the host and the probability of the player switching can be specified.
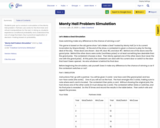
This resource consists of a Java applet and expository text. The applet …
This resource consists of a Java applet and expository text. The applet consists of the Monty Hall game: a car is behind one door and goats are behind the other two doors. The player makes an initial choice and the host opens a different door. The player is then given the option of switching to the remaining door. The stochastic behavior of the host can be specified.
Students pair up to conduct a simulation of the Monty Hall problem. …
Students pair up to conduct a simulation of the Monty Hall problem. Partners use cards for the first trials and virtual manipulatives for the rest. In doing so, students experience conditional probability and understand the Law of Large Numbers. Key is practical application of decision-making based on probability.
Video Description: Have you ever wondered what living in space would do to …
Video Description: Have you ever wondered what living in space would do to your body? In this Real World video, learn how NASA scientists study cells on Earth to learn how to protect astronauts from radiation during space flights. Dr. Egle Cekanaviciute describes changes in cells and cell organelles. She also compares quantitative and qualitative data and demonstrates how to calculate the percentage of mutated cells. Video length: 6:35.NASA eClipsTM is a suite of online student-centered, standards-based resources that support instruction by increasing STEM literacy in formal and nonformal settings. These free digital and downloadable resources inform and engage students through NASA-inspired, real-world connections.NASA eClips Real World segments (grades 6-8) connect classroom mathematics to 21st Century careers and innovations. They are designed for students to develop an appreciation for mathematics through real-world problem solving.
This resource consists of a Java applet and descriptive text. The applet …
This resource consists of a Java applet and descriptive text. The applet illustrates the number of trials needed to get a specified number of successes in Bernoulli trials, in terms of random points on a discrete timeline. The applet illustrates the negative binomial distribution. The number of successes and the probability of success can be varied.
No restrictions on your remixing, redistributing, or making derivative works. Give credit to the author, as required.
Your remixing, redistributing, or making derivatives works comes with some restrictions, including how it is shared.
Your redistributing comes with some restrictions. Do not remix or make derivative works.
Most restrictive license type. Prohibits most uses, sharing, and any changes.
Copyrighted materials, available under Fair Use and the TEACH Act for US-based educators, or other custom arrangements. Go to the resource provider to see their individual restrictions.