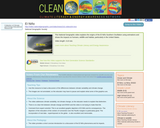
This National Geographic video explains the origins of the El Nno Southern …
This National Geographic video explains the origins of the El Nno Southern Oscillation using animations and shows the impacts on humans, wildlife and habitat, particularly in the United States.
This video, from the US Department of Energy, shows the basics of …
This video, from the US Department of Energy, shows the basics of how a PV panel converts light radiated from the sun into usable power, whether on the electric grid or off, and without emissions or the use of fossil fuels.
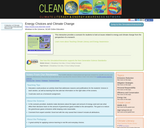
This interactive provides a new way for students to look at issues …
This interactive provides a new way for students to look at issues related to energy and climate change. In the scenarios within this module, students make decisions about the types and amount of energy used and see what effect their decisions have on the amount of greenhouse gases emitted to the atmosphere. Their goal is to reduce the amount of warming greenhouse gases added to the atmosphere from fossil fuel emissions while keeping costs within reason.
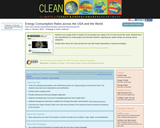
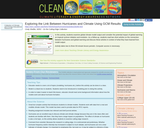
Students use Google Earth to analyze oil consumption per capita in the …
Students use Google Earth to analyze oil consumption per capita in the US and around the world. Students then use spreadsheets to create graphs and calculate statistics regarding per capita energy use among various categories.
This activity is a learning game in which student teams are each …
This activity is a learning game in which student teams are each assigned a different energy source. Working cooperatively, students use their reading, brainstorming, and organizational skills to hide the identity of their team's energy source while trying to guess which energy sources the other teams represent.
This video provides an introduction to benefits and limitations of many sources …
This video provides an introduction to benefits and limitations of many sources of energy including fossil fuels, nuclear, hydro, wind, solar, geothermal and biomass. It also discusses hydrogen and hybrid cars.
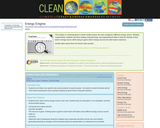
This online calculator converts from one energy unit to another - from …
This online calculator converts from one energy unit to another - from gallons to British thermal units (Btu), kilowatt/hours to megajoules, short tons to metric tons.
An activity focusing on black carbon. This activity explores the impacts of …
An activity focusing on black carbon. This activity explores the impacts of the use of wood, dung, and charcoal for fuel, all which generate black carbon, in developing countries.
This activity introduces students to different forms of energy, energy transformations, energy …
This activity introduces students to different forms of energy, energy transformations, energy storage, and the flow of energy through systems. Students learn that most energy can be traced back to nuclear fusion on the sun.
This long classroom activity introduces students to a climate modeling software. Students …
This long classroom activity introduces students to a climate modeling software. Students visualize how temperature and snow coverage might change over the next 100 years. They run a 'climate simulation' to establish a baseline for comparison, do a 'experimental' simulation and compare the results. Students will then choose a region of their own interest to explore and compare the results with those documented in the IPCC impact reports. Students will gain a greater understanding and appreciation of the process and power of climate modeling.
These flow charts show carbon dioxide emissions for each state, the District …
These flow charts show carbon dioxide emissions for each state, the District of Columbia and the entire United States. Emissions are distinguished by energy source and end use.
This Energy Flow Charts website is a set of energy Sankey diagrams …
This Energy Flow Charts website is a set of energy Sankey diagrams or flow charts for 136 countries constructed from data maintained by the International Energy Agency (IEA) and reflects the energy use patterns for 2007.
Sankey (or Spaghetti) diagrams parse out the energy flow by state, based …
Sankey (or Spaghetti) diagrams parse out the energy flow by state, based on 2008 data from the Dept. of Energy. These diagrams can help bring a local perspective to energy consumption. The estimates include rejected or lost energy but don't necessarily include losses at the ultimate user end that are due to lack of insulation.
This is a semester-long jigsaw project in which students work in teams …
This is a semester-long jigsaw project in which students work in teams to explore the effects of energy resource development on local water resources, economics, and society. Students are presented with a contemporary energy resource development issue being debated in their community. They research the water, geological, economic, and social impact of the project, and then either defend or support the development proposal.
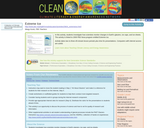
In this activity, students make a model sea floor sediment core using …
In this activity, students make a model sea floor sediment core using two types of buttons to represent fossil diatoms. They then compare the numbers of diatom fossils in the sediment at different depths to determine whether the seas were free of ice while the diatoms were alive.
In this lesson, students complete a Myers-Briggs Type Inventory of their personality …
In this lesson, students complete a Myers-Briggs Type Inventory of their personality type as an introductory step to understanding what green jobs might suit their personal styles. From the information on this online tool, they look at different Green Jobs to explore possible careers.
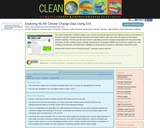
This Earth Exploration Toolbook chapter uses ArcGIS and climate data from the …
This Earth Exploration Toolbook chapter uses ArcGIS and climate data from the National Center for Atmospheric Research (NCAR) Climate Change Scenarios GIS Data Portal to help users learn the basics of GIS-based climate modeling. The five-part exercise involves calculating summer average temperatures for the present day and future climate modeled output, visually comparing the temperature differences for the two model runs, and creating a temperature anomaly map to highlight air temperature increases or decreases around the world.
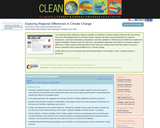
This teaching activity addresses regional variability as predicted in climate change models …
This teaching activity addresses regional variability as predicted in climate change models for the next century. Using real climatological data from climate models, students will obtain annual predictions for minimum temperature, maximum temperature, precipitation, and Solar Radiation for Minnesota and California to explore this regional variability. Students import the data into a spreadsheet application and analyze it to interpret regional differences. Finally, students download data for their state and compare them with other states to answer a series of questions about regional differences in climate change.
In this activity, students examine global climate model output and consider the …
In this activity, students examine global climate model output and consider the potential impact of global warming on tropical cyclone initiation and evolution. As a follow-up, students read two short articles on the connection between hurricanes and global warming and discuss these articles in context of what they have learned from model output.
This activity from PBS Teachers guides students through the ways scientists monitor …
This activity from PBS Teachers guides students through the ways scientists monitor changes in Earth's glaciers, ice caps, and ice sheets. Students investigate about glacier locations, glacial movement, and impacts of climate change on glaciers depending on the depth of research. It is linked to 2009 PBS Nova program entitled Extreme Ice.
No restrictions on your remixing, redistributing, or making derivative works. Give credit to the author, as required.
Your remixing, redistributing, or making derivatives works comes with some restrictions, including how it is shared.
Your redistributing comes with some restrictions. Do not remix or make derivative works.
Most restrictive license type. Prohibits most uses, sharing, and any changes.
Copyrighted materials, available under Fair Use and the TEACH Act for US-based educators, or other custom arrangements. Go to the resource provider to see their individual restrictions.