Lesson Delivery: Students will collect weather data for a given city/town from …
Lesson Delivery: Students will collect weather data for a given city/town from a weather website to analyze and create a graph that displays the change in temperature over a time period (one or twq weeks). Useful Sites: Create a Graph: https://nces.ed.gov/nceskids/createagraph/Default.aspx Weather Data: https://www.weather.gov/wrh/climate
This resource involves students completing a series of four graphs representing how …
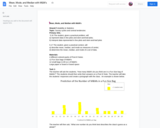
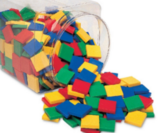
This resource involves students completing a series of four graphs representing how many M&M's they predict are in fun size and small bags of M&M's, and the actual number that are present. After collecting data and graphing the results, students will place the data on stem and leaf plots. Next, students will determine the mean, mode, and median for each set of data, and decide which measure of center is most accurate for describing the number of M&M's in the bag. Lastly, students will compare the amount of M&Ms in the fun size bag to those in the small bag.
Video Description: What are citizen scientists? Why is their work so important to …
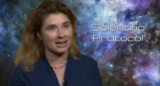
Video Description: What are citizen scientists? Why is their work so important to NASA? Join Dr. Michelle Thaller as she explains how the general public, using scientific protocols, careful observations and accurate measurements, can help NASA make exciting new discoveries. Find out how you can be a citizen scientist today. Video Length: 4:26.NASA eClipsTM is a suite of online student-centered, standards-based resources that support instruction by increasing STEM literacy in formal and nonformal settings. These free digital and downloadable resources inform and engage students through NASA-inspired, real-world connections.NASA eClips Real World segments (grades 6-8) connect classroom mathematics to 21st Century careers and innovations. They are designed for students to develop an appreciation for mathematics through real-world problem solving.
Video Description: Satellites are expensive to build and expensive to get into space. …
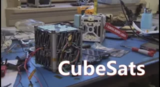
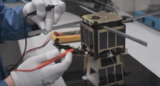
Video Description: Satellites are expensive to build and expensive to get into space. With all the changes in technology, is there a way to make satellites smaller? Find out just what NASA can pack into a 1U CubeSat, a satellite small enough to fit in your hand. Video Description: 3:24.NASA eClipsTM is a suite of online student-centered, standards-based resources that support instruction by increasing STEM literacy in formal and nonformal settings. These free digital and downloadable resources inform and engage students through NASA-inspired, real-world connections.NASA eClips Real World segments (grades 6-8) connect classroom mathematics to 21st Century careers and innovations. They are designed for students to develop an appreciation for mathematics through real-world problem solving.
Video Description: CubeSats are changing the way we collect information. They may be …
Video Description: CubeSats are changing the way we collect information. They may be small, but these little satellites are helping us answer big questions. And using a swarm of CubeSats can give us simultaneous measurements without repeatedly sending commands to the satellite to tell it what to do.Video Length: 2:21.NASA eClipsTM is a suite of online student-centered, standards-based resources that support instruction by increasing STEM literacy in formal and nonformal settings. These free digital and downloadable resources inform and engage students through NASA-inspired, real-world connections.NASA eClips Real World segments (grades 6-8) connect classroom mathematics to 21st Century careers and innovations. They are designed for students to develop an appreciation for mathematics through real-world problem solving.
This google slides activity will assist students in making connections with proportional …
This google slides activity will assist students in making connections with proportional reasoning. Students will create tables, equivalent ratios, and graph friendly scenarios. Draggable objects are available for students who need manipulatives to figure it out.
No restrictions on your remixing, redistributing, or making derivative works. Give credit to the author, as required.
Your remixing, redistributing, or making derivatives works comes with some restrictions, including how it is shared.
Your redistributing comes with some restrictions. Do not remix or make derivative works.
Most restrictive license type. Prohibits most uses, sharing, and any changes.
Copyrighted materials, available under Fair Use and the TEACH Act for US-based educators, or other custom arrangements. Go to the resource provider to see their individual restrictions.