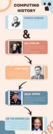
This resource an inforgraphic that talks about includes Charles Babbage, Ada Lovelace, …
This resource an inforgraphic that talks about includes Charles Babbage, Ada Lovelace, Alan Turing, Grace Hopper, and Tim Berners-Lee. These are the significant historical figures listed in the Middle School Elective Curriculum Framework, MSCSE.6, context of the standard.
The attached infographic resource document descibes ways to engage English Learners in dance …
The attached infographic resource document descibes ways to engage English Learners in dance classrooms by making learning visible, supporting the language of visual arts, connecting learning to students' backgrounds and skills, using cooperative learning structures and strategies, and reducing cognitive load and allowing processing time.
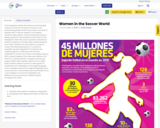
This infographic details the influence and changing culture of women in the …
This infographic details the influence and changing culture of women in the sport of soccer. It is an empowering graphic that can be used in any level of Spanish with or without support.
If you believe students need support, use the circling technique of asking questions surrounding the information in the infographic. Start with yes/no questions, followed by either/or questions and lastly open ended questions.
From there, students can work alone or in pairs to answer the following questions:
1) ¿Cuál es el propósito de esta infografía? 2) ¿Cuántas más mujeres jugarán en 2019 que el año de esta infografía? 3) ¿Si hoy hay 3 veces más equipos que en 1991, ¿cuántos equipos más crees que habrán en 20 años? 4) ¿Cuántas chicas o mujeres conoces que juegan futbol?
After students report out as a class, have students research women in other sports to create their own infographic in the target language. Once complete, pass out the original infographic and a new one from a classmates and have the pair fill out a venn diagram to show the similarities and differences among women in different sports throughout the world.
No restrictions on your remixing, redistributing, or making derivative works. Give credit to the author, as required.
Your remixing, redistributing, or making derivatives works comes with some restrictions, including how it is shared.
Your redistributing comes with some restrictions. Do not remix or make derivative works.
Most restrictive license type. Prohibits most uses, sharing, and any changes.
Copyrighted materials, available under Fair Use and the TEACH Act for US-based educators, or other custom arrangements. Go to the resource provider to see their individual restrictions.