Students are to research a topic and present the topic by either …
Students are to research a topic and present the topic by either trying to convince you one way or another about the topic or leaving you to make your choice.
The student will use a table of personal data collected about plugged/unplugged …
The student will use a table of personal data collected about plugged/unplugged activites and times of rest throughout the period of one week (7 days) to document screen times in comparison to active and restful breaks for a computer science integration and digital balance project.This Part 1 activity uses the data collected in a table to teach students how to copy and paste a table from Docs into Slides, and how to develop a Slideshow Presentation with tables (Part 1) and graphs (Part 2). Students are given opportunities to collect and analyze data, to enter information into tables and graphs, to develop and share presentations in Slides, as well as summarize and draw conclusions about the data collection, graphing, and results as comparable to their peers, digital categories, or peer groups (Gamers vs YouTubers, Boys vs Girls, etc.).The goal/s of this unit is to help students realize the importance of living a digitally balanced life and to help students develop skills for creating and using digital tables and graphs with an introduction to data collection and analysis.
The student will use previously collected personal and peer data (Part 1: …
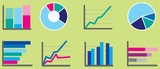
The student will use previously collected personal and peer data (Part 1: Screen Time Logs) to graph a bar and pie graph in Slides using Sheets to graph the data collected.This is the second part of an intended presentation project for a computer CTE middle school class, but can be edited and adapted for any graphing and/or computer integration lessons about bar and pie graphs and how to make them in Google Sheets using Google Slides.
In this lesson students will be able to identify that computers, like …
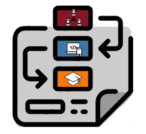
In this lesson students will be able to identify that computers, like the solar system, complete predictable actions based on a set of variables. Students will learn about the solar system via Scratch. They will explore block coding and computational thinking practices as they utilize Scratch as a tool for creativity, expression and learning about the Solar System.
No restrictions on your remixing, redistributing, or making derivative works. Give credit to the author, as required.
Your remixing, redistributing, or making derivatives works comes with some restrictions, including how it is shared.
Your redistributing comes with some restrictions. Do not remix or make derivative works.
Most restrictive license type. Prohibits most uses, sharing, and any changes.
Copyrighted materials, available under Fair Use and the TEACH Act for US-based educators, or other custom arrangements. Go to the resource provider to see their individual restrictions.