The Census Flows Mapper is a web mapping application intended to provide …
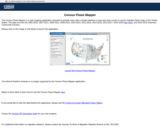
The Census Flows Mapper is a web mapping application intended to provide users with a simple interface to view, save and print county-to-county migration flows maps of the United States. The data are from the 2006-2010 American Community Survey.
The mission of the Data Resource Center for Child and Adolescent Health …
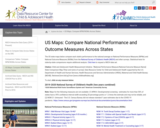
The mission of the Data Resource Center for Child and Adolescent Health (DRC) is to advance the effective use of public data on the status of children’s health and health-related services for children, youth and families in the United States. The DRC does this by providing hands-on access to national, state, and regional data findings from large population-based surveys. Data are collected from parents and thus contribute a much needed voice in the drive to improve the quality of health care for children and youth.
Interactive tables provides data on home ownership, housing expenses, education, health and …
Interactive tables provides data on home ownership, housing expenses, education, health and other topics. Data can be presented by nation,region, and city (only in US).
The goal of this exercise is to examine the relationship between demographic …
The goal of this exercise is to examine the relationship between demographic characteristics and different forms of civic participation. Crosstabulation will be used.
Lecture notes for a lesson at MIT on game theoretical approaches to …
Lecture notes for a lesson at MIT on game theoretical approaches to decision making, including decision making with uncertain information and analysis of risk. The lesson primarily covers game theory and not economic applications.
This interactive tools allows the user to learn which countries parallel the …
This interactive tools allows the user to learn which countries parallel the states, provinces or territories of the United States, China, India and Brazil and presents country equivalent data for both GDP and population.
This interactive tool allows the user to view global housing prices by …
This interactive tool allows the user to view global housing prices by country and time frame, and housing price index, the percentage of change over time, housing price in real terms, house prices compared to rents, or house price against average income.
The goal of this module is to explore the relationship between demographic …
The goal of this module is to explore the relationship between demographic characteristics and educational attainment. Frequencies and comparison of means will be used.
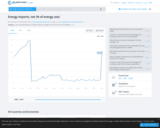
Data set and map pertaining to energy production for all countries. The …
Data set and map pertaining to energy production for all countries. The World Bank specifies energy production as a World Development Indicator (WDI) -- the statistical benchmark that helps measure the progress of development.
The goal of this exercise is to explore attitude consistency and the …
The goal of this exercise is to explore attitude consistency and the ideological dimensions of attitudes about euthanasia. Frequency distributions and crosstabulations will be used.
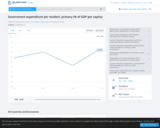
Data set and map pertaining to expenditure per secondary school student for …
Data set and map pertaining to expenditure per secondary school student for all countries as a percentage of their GDP per capita. The World Bank specifies expenditure per student as a World Development Indicator (WDI) -- the statistical benchmark that helps measure the progress of development.
No restrictions on your remixing, redistributing, or making derivative works. Give credit to the author, as required.
Your remixing, redistributing, or making derivatives works comes with some restrictions, including how it is shared.
Your redistributing comes with some restrictions. Do not remix or make derivative works.
Most restrictive license type. Prohibits most uses, sharing, and any changes.
Copyrighted materials, available under Fair Use and the TEACH Act for US-based educators, or other custom arrangements. Go to the resource provider to see their individual restrictions.