Student will:analyze a map of the Chesapeake Baycalculate the mean, median, mode, …
Student will:analyze a map of the Chesapeake Baycalculate the mean, median, mode, range, and numbercreate an appropriate graphinvestigate data provided by the James River and apply learning
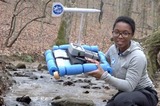
Join Chesapeake Bay Foundation educators Maya, Rick, and Norah as they lead …
Join Chesapeake Bay Foundation educators Maya, Rick, and Norah as they lead you on a journey through the Chesapeake Bay watershed. Investigate how we are all part of a watershed as you twist and turn from the Appalachian Mountains, through the rivers and streams of Piedmont, all the way down to the Chesapeake Bay. Along your journey, you’ll meet the unique critters that call the watershed home. You’ll also explore what you can do in your own neighborhood to protect the environment and become a Backyard Bay Saver!
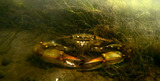
This lesson is intended to review 6th-grade content on watersheds, estuaries, and …
This lesson is intended to review 6th-grade content on watersheds, estuaries, and wetlands. It also introduces abiotic and biotic factors of ecosystems found in VA's Watershed. Students investigate the Chesapeake Bay using several resources with a pre-assessment, video clips, current article links, post-assessment, final evaluation, and rubric. A student sheet, teacher key, and google slide were created to use for face-to-face teaching or virtual learning. Click on the attached to access the folder.
Students will create an informational poster, collage, slide show, cartoon, or video …
Students will create an informational poster, collage, slide show, cartoon, or video clip of a specific ecosystem in our watershed. Requirements are as follows:pick a specific tributary, estuary, or wetland. show at least 4 abiotic and 4 biotic factors plus the location that you choseinclude 4 or more pictures to help show the parts of the ecosystem. cite the sources with the website, title of the site, author, and publishing dateA rubric is included
Students will analyze data from the "State of the Bay" reports from …
Students will analyze data from the "State of the Bay" reports from the Chesapeake Bay Foundation while reviewing and completing the scientific method. The final assessment is a mission for students to create a persuasive speech or advertisement that will call for action to make changes that will positively impact the watershed with reasons why change is important.
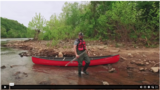
Climate change is impacting the James River and there are different issues …
Climate change is impacting the James River and there are different issues and solutions for different parts of the river. Travel down the James with Matt Scott of the James River Association to explore the watershed and learn about the impacts of sediment in Lynchburg, flooding in Richmond, and sea level rise and erosion in Hampton Roads. Learn about some of the solutions being used now to help tackle these problems. This video was developed to support the 6th grade Science SOLs in Virginia and associated lesson plans are available. A production of VPM in collaboration with the Virginia Department of Education.
Students will learn about The Water Walker, Josephine Mandamin, and discuss and …
Students will learn about The Water Walker, Josephine Mandamin, and discuss and research topics related to the protection of our water sources. Students will then take their research and consider how advancements in technology over the past 50 years (specifically transportation and and business (shipping, manufacturing) have impacted the local water supplies.This lesson was created through a partnership between CodeVA and the Virginia Tribal Education Consortium (VTEC).
A model is used to demonstrate what a watershed is and students go on …
A model is used to demonstrate what a watershed is and students go on a watershed walk to identify the path water travels within their school community and neighborhoods. Students will document their neighborhood walks and create a watershed model to share with the class. They will note areas of concern (erosion, deposition, etc.) and present a solution. Students will create and implement a plan to address the area of concern and analyze results.
No restrictions on your remixing, redistributing, or making derivative works. Give credit to the author, as required.
Your remixing, redistributing, or making derivatives works comes with some restrictions, including how it is shared.
Your redistributing comes with some restrictions. Do not remix or make derivative works.
Most restrictive license type. Prohibits most uses, sharing, and any changes.
Copyrighted materials, available under Fair Use and the TEACH Act for US-based educators, or other custom arrangements. Go to the resource provider to see their individual restrictions.