
In this lesson students will practice computing the average or mean of 3 or more menu prices or numbers with decimals.
- Subject:
- Computation and Estimation
- Data and Analysis
- Material Type:
- Activity/Lab
- Author:
- Kevin Yates
- Date Added:
- 04/19/2021

In this lesson students will practice computing the average or mean of 3 or more menu prices or numbers with decimals.

Teacher Instructs the student to navigate to Google.com. The teacher will model researching their career by typing in the search box, “What is the average salary for a teacher in Virginia.” The teacher will ask what does average salary mean and add details to the students’ responses. The teacher will then pull up the Google Sheet to be used for today’s lesson. Students will begin researching their own career choice by typing, “What is the average salary of a _______________________ in VIrginia? The students will find a low, average, and top salary for their career choices. The students will use the average or middle salary given. If more than one average is given the students will use the mathematical equation for finding the mean to calculate the average of the salaries given.

Students will lead discussion on their net pay for their chosen career, their total expenses, and the amount they will have left after paying all the monthly expenses. If there wasn’t enough money to pay all their expenses what will they need to do?

Students will research the cost of homes and expences associated with owning a home. This proccess will help the studet to determine if thier chosen salary will support the purchase of the selected home.

Students will pretend they have a family of 4. Use the list given by students and make sure the following are included: average cost of groceries for a family of 4average cost of health insurance for a family of 4average cost of dining out for a family of 4 (multiply this by 4 for eating out once a week)average monthly internet feeaverage monthly cable or satellite

The teacher will lead discussion on cost of the vehicle versus the salary made for his/her career. What are the pros and cons of this vehicle? Students will then research the type of vehicle they want. Each student will determine the cost of the vehicle. Students will share with each other the type of vehicle they chose, the cost of the vehicle, and the pros and cons of the vehicle.

Students will read a passage, extract useful and meaningful data, organize and clean the data, and finally represent the data as a graph. Using the following site:https://nces.ed.gov/nceskids/createagraph/6.8 The student will use computational tools to collect, organize, and clean data to make it more useful and reliable.

In small groups, students will be assigned two of the first ten amendments and pose the questions, “Which of these two amendments do you think is more important?” and “Why do you believe this?” in a survey of ten classmates. Then they will collect and organize the data electronically to create two visual representations of their information. Students will add their raw data and visualizations to a shared slideshow to present their findings to the class and explain why they chose this particular visualization model and what conclusions they can draw from their survey responses.This material is based upon work supported by the National Science Foundation under Grant No. 2010256.Any opinions, findings, and conclusions or recommendations expressed in this material are those of the author(s) and do not necessarily reflect the views of the National Science Foundation.

Demonstrate Google Search tips and tricks Using “ “ around a search term to tell Google the results must include the words inside the quotation marksUsing - in the search term to tell google to exclude something from the results ex. search apple -fruit will give results about apple the company with out any results about apple the fruit.Using site: to search with in a particular website you have deemed creditable. ex. search site: www.cnn.com Use OR to search for either one search term or another ex. search climate change or global warming
Vocabulary posters for the Data & Analysis strand for Grade 6. Words included are from the 2017 Computer Science Curriculum Framework.

Students analyze a chart with the characteristics of the three colonial regions and determine a better way to visualize the information that shows the similarities and differences between the three.This material is based upon work supported by the National Science Foundation under Grant No. 2010256.Any opinions, findings, and conclusions or recommendations expressed in this material are those of the author(s) and do not necessarily reflect the views of the National Science Foundation.

Students will gather information regarding the cultural and economic interactions between Europeans and American Indians during Westward Expansion. Students will work in groups to analyze several primary sources and create a visual representation depicting the Native vs. European perspectives of westward expansion.

Following Curiosity and Perseverance on Mars often means roving to places with interesting materials to study, places away from the initial landing site. In this lesson, students experience the processes involved in engineering a communication protocol. To reach their goal, students must create a calibrated solution within constraints and parameters of communicating with a rover on Mars. Students will explore the opportunities and challenges of remote robotics by framing the problem around the idea that scientists and computer scientists must work together to successfully program rovers in remote locations like Mars. Students will also explore the idea that a robot simply follows a set of well defined algorithms. Students will be provided a set of possible courses that their robot must navigate. Students will code their robot to navigate around the obstacles within the course to arrive at a set location.

In this lesson students will be able to identify that computers, like the solar system, complete predictable actions based on a set of variables. Students will learn about the solar system via Scratch. They will explore block coding and computational thinking practices as they utilize Scratch as a tool for creativity, expression and learning about the Solar System.

This lesson is part of a unit based on a road trip. In this lesson students use the given website to research diffrent attributes of cars and trucks that would make them desirable choices.
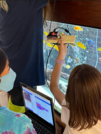
Students are practicing using Scratch programming to program microbit sensors to continually read temperature. Doing this will familiarize students with the Scratch programming software to program TDS and Temperature sensors for the fishtank in the hallway.

In this activity students will analyze various forms of primary sources, images and text, based on differing accounts of the Boston Massacre. Students will use this information to construct a historically accurate timeline (story) using the website twinery.org.

In this lesson, students will organize and visualize data from indentured contract databases from virtualjamestown.org in order to come to some conclusions about the characteristics of indentured servants in early colonial America. They will make specific decisions about how to organize the data and how to best visualize the data. They will then use the data to draw conclusions about indentured servants in early colonial Virginia, culminating in a creative journal entry assignment. Additional lessons can have students search for and analyze data on the enslaved Africans of early colonial Virginia in order to compare and contrast the two forms of labor in colonial Virginia.

Students will sort and analyze data about a historical figure from the American Revolution then create a desk depicting the accomplishments, life events and/or experiences, positive and negative of the historical figure of that individual. Students will work in heterogeneous groups on a project where they sort data and analyze data about a historical figure during the American Revolution. Students will use the data collected to create a depiction of the historical figure’s desk.