You are planning a special trip to a place you have always …
You are planning a special trip to a place you have always wanted to visit. You will need to know the weather trends for a specific time of year so that you will know what to pack. Students will create a presentation to organize their packing that should include a line graph included with data collected about local weather and communicate what they should pack and why based on their findings. Students will need to get feedback from peers if their conclusions for they need to pack align with the weather observed. Students will use either a digital format or print format to predict what to pack for a trip of their choosing for two weeks. Students will choose a location, make a prediction, collect weather data, and analyze their results with a graph. Lastly, they will present to classmates to convince them to travel to their location and what to pack.
Students will explore Virginia and its border states (Maryland, Kentucky, West Virginia, …
Students will explore Virginia and its border states (Maryland, Kentucky, West Virginia, Tennessee, and North Carolina) then pick one of them to look at data of the monthly average high and low temperatures. Students will collect the data and use it to create a graph in Google Sheets. The graph will have correct titles and labeling. Students will also learn to predict as well as compare and contrast. This lesson integrates well into Social Studies, Math, Language Arts, Science and Computer Science.
1. Have the students bring a Math graphing problem that they have …
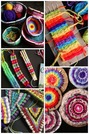
1. Have the students bring a Math graphing problem that they have been working on in class. **This will take some coordination with their homeroom teacher in order to work! or present a simple graphing problem for them to solve. It needs to have 3-4 variables. This is so that they can use 3-4 coordinating colors of yarn for their design.In this lesson, we will translate the bar graph chart into a horizontal graph design. Use the numbers to represent rows of weaving. For example, if a 5 is represented in the information then color in a section of rows on the graph paper to represent 5 rows that will be woven in that color. Tell the students to use the same colors that they have on their math bar graph, when creating their graph for weaving so that there is less confusion.
No restrictions on your remixing, redistributing, or making derivative works. Give credit to the author, as required.
Your remixing, redistributing, or making derivatives works comes with some restrictions, including how it is shared.
Your redistributing comes with some restrictions. Do not remix or make derivative works.
Most restrictive license type. Prohibits most uses, sharing, and any changes.
Copyrighted materials, available under Fair Use and the TEACH Act for US-based educators, or other custom arrangements. Go to the resource provider to see their individual restrictions.