Use a series of interactive models and games to explore electrostatics. Learn …
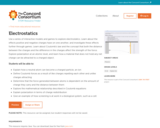
Use a series of interactive models and games to explore electrostatics. Learn about the effects positive and negative charges have on one another, and investigate these effects further through games. Learn about Coulomb's law and the concept that both the distance between the charges and the difference in the charges affect the strength of the force. Explore polarization at an atomic level, and learn how a material that does not hold any net charge can be attracted to a charged object. Students will be able to:
Data set and map pertaining to energy production for all countries. The …
Data set and map pertaining to energy production for all countries. The World Bank specifies energy production as a World Development Indicator (WDI) -- the statistical benchmark that helps measure the progress of development.
Data set and map pertaining to energy production for all countries. The …
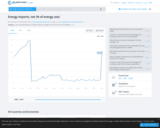
Data set and map pertaining to energy production for all countries. The World Bank specifies energy production as a World Development Indicator (WDI) -- the statistical benchmark that helps measure the progress of development.
No sitting American president traveled outside the country before Theodore Roosevelt traveled …
No sitting American president traveled outside the country before Theodore Roosevelt traveled to Panama in 1906 to see the construction of the Panama Canal. A century later Air Force One regularly carries the head of the executive branch to all corners of the world. The Executive Abroad maps the international trips of presidents and secretaries of state.
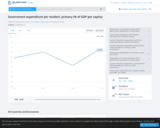
Data set and map pertaining to expenditure per secondary school student for …
Data set and map pertaining to expenditure per secondary school student for all countries as a percentage of their GDP per capita. The World Bank specifies expenditure per student as a World Development Indicator (WDI) -- the statistical benchmark that helps measure the progress of development.
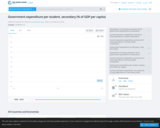
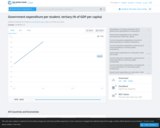
Data set and map pertaining to expenditure per tertiary school student for …
Data set and map pertaining to expenditure per tertiary school student for all countries as a percentage of their GDP per capita. The World Bank specifies expenditure per student as a World Development Indicator (WDI) -- the statistical benchmark that helps measure the progress of development.
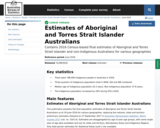
This product contains final experimental estimates of the Aboriginal and Torres Strait …
This product contains final experimental estimates of the Aboriginal and Torres Strait Islander (Indigenous), non-Indigenous and total populations of Australia at 30 June 2006, for various geographies.
The decades between the banning of the international slave trade in 1808 …
The decades between the banning of the international slave trade in 1808 and the abolition of slavery during the Civil War saw the massive and harrowing relocation of approximately 850,000 enslaved men, women, and children. While some enslaved people were moved when their owners relocated to the western frontier, about two-thirds were bought and sold in America’s slave market. They were forcibly uprooted from their homes, separated from their loved ones, and marched and shipped across the South on railroads and steamships.
At all points in its history, a significant proportion of the population …
At all points in its history, a significant proportion of the population of the United States had been born in other countries and regions. This being the case, American history can never be understood by just looking within its borders. The culture and politics of the US have always been profoundly shaped by the material and emotional ties many of its residents have had to the places where they were born. This map will allow you to begin to explore those connections at the basic level of demographic statistics.
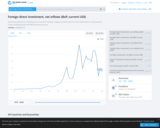
Data set and map pertaining to foreign direct investment for all countries. …
Data set and map pertaining to foreign direct investment for all countries. This series shows net inflows (new investment inflows less disinvestment) in the reporting economy from foreign investors. Data are in current U.S. dollars. The World Bank specifies foreign direct investment as a World
In this activity, students study gas laws at a molecular level. They …
In this activity, students study gas laws at a molecular level. They vary the volume of a container at constant temperature to see how pressure changes (Boyle's Law), change the temperature of a container at constant pressure to see how the volume changes with temperature (Charles’s Law), and experiment with heating a gas in a closed container to discover how pressure changes with temperature (Gay Lussac's Law). They also discover the relationship between the number of gas molecules and gas volume (Avogadro's Law). Finally, students use their knowledge of gas laws to model a heated soda can collapsing as it is plunged into ice water.
The Geniverse software is being developed as part of a five-year research …
The Geniverse software is being developed as part of a five-year research project funded by the National Science Foundation. Still in its early stages, a Beta version of the software is currently being piloted in six schools throughout New England. We invite you to try the current Beta version, keeping in mind that you may encounter errors or pages that are not fully functional. If you encounter any problem, it may help to refresh or reload the web page.
Explore how the Earth's atmosphere affects the energy balance between incoming and …
Explore how the Earth's atmosphere affects the energy balance between incoming and outgoing radiation. Using an interactive model, adjust realistic parameters such as how many clouds are present or how much carbon dioxide is in the air, and watch how these factors affect the global temperature.
Data set and map pertaining to health expenditure per capita for all …
Data set and map pertaining to health expenditure per capita for all countries . The World Bank specifies health expenditure as a World Development Indicator (WDI) -- the statistical benchmark that helps measure the progress of development.
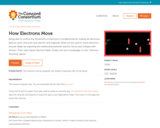
Being able to control the movement of electrons is fundamental for making …
Being able to control the movement of electrons is fundamental for making all electronic devices work. Discover how electric and magnetic fields can be used to move electrons around. Begin by exploring the relationship between electric forces and charges with vectors. Then, learn about electron fields. Finally, test your knowledge in a fun "Electron Shooting" game!
Map of Africa coded by the number of underweight children per square …
Map of Africa coded by the number of underweight children per square kilometer. It is thus a measure of the absolute density of hungry individuals, a combination of hunger and population density.
Map of Asia color coded by infant mortality rate broken down by …
Map of Asia color coded by infant mortality rate broken down by nation or subnational units (akin to US states or Canadian provinces). Shows the international differences, but also shows the (less substantial) differences within nations. The categories for the color coding have been changed slightly from the international standards to better fit the situation in Asia.
No restrictions on your remixing, redistributing, or making derivative works. Give credit to the author, as required.
Your remixing, redistributing, or making derivatives works comes with some restrictions, including how it is shared.
Your redistributing comes with some restrictions. Do not remix or make derivative works.
Most restrictive license type. Prohibits most uses, sharing, and any changes.
Copyrighted materials, available under Fair Use and the TEACH Act for US-based educators, or other custom arrangements. Go to the resource provider to see their individual restrictions.