You are planning a special trip to a place you have always …
You are planning a special trip to a place you have always wanted to visit. You will need to know the weather trends for a specific time of year so that you will know what to pack. Students will create a presentation to organize their packing that should include a line graph included with data collected about local weather and communicate what they should pack and why based on their findings. Students will need to get feedback from peers if their conclusions for they need to pack align with the weather observed. Students will use either a digital format or print format to predict what to pack for a trip of their choosing for two weeks. Students will choose a location, make a prediction, collect weather data, and analyze their results with a graph. Lastly, they will present to classmates to convince them to travel to their location and what to pack.
Your task as an astronomer is to model the solar system using …
Your task as an astronomer is to model the solar system using technology. You and your crew are just one group that have been asked by NASA to chart the solar system in order to create a simulation model for future astronauts. After you have accomplished this, you will present your model to the Director of NASA. They have given you several requirements for the simulation. Your simulation should include a map of the solar system that shows the appropriate distance, location, size and relation to the sun amongst the eight planets. You and your team can use a variety of options to complete your simulation. These include Google Suite tools (such as Google Slides, Google Docs, Jamboard, or any equivalent tool such as Microsoft Office), Coding resources (Scratch.edu, tynker.edu) or 3D printing software (Tinkercad) to present. Your map should also include a short descriptive paragraph for each planet explaining its distance, location, size, and at least 3 facts about the planet. If creating a video, you will still want to include descriptions for the planets as well as the three facts. Presentation to “NASA Directors” must answer the question: how does this simulation/model help future scientists?
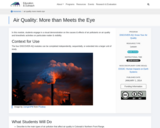
In this module, students engage in a visual demonstration on the causes …
In this module, students engage in a visual demonstration on the causes & effects of air pollutants on air quality and kinesthetic activities on particulate matter & visibility.
Student will:analyze a map of the Chesapeake Baycalculate the mean, median, mode, …
Student will:analyze a map of the Chesapeake Baycalculate the mean, median, mode, range, and numbercreate an appropriate graphinvestigate data provided by the James River and apply learning
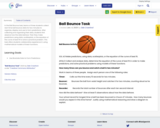
In the Ball Bounce task, teams of three students collect real-time ball …
In the Ball Bounce task, teams of three students collect real-time ball bounce data for two minutes to organize, display and use to form predictions. After collecting and organizing their data, students first observe how the data behave. Then they make predictions using data, scatterplots, or the equation of the curve of best fit to solve a practical problem. This task offers students collaborative experience in using mathematical models of linear functions.
This activity will show the sorting process using the Bubble Sort Brute …
This activity will show the sorting process using the Bubble Sort Brute Force algorithm that is used by a computer when sorting data without using a computer.
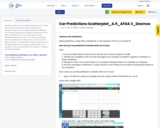
Students research two variables about the car model they intend to purchase. …
Students research two variables about the car model they intend to purchase. They use Desmos to compare these same variables across five different car models. Students use analysis of bivariate data in order to decide which car makes sense to buy. Students prepare and share a summary statement and include desmos screen shots in order to justify their purchase. This task offers students experiences in making predictions, using data, scatterplots, or the equation of the curve of best fit for decision-making in a practical problem.
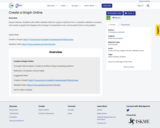
Lesson Delivery: Students will collect weather data for a given city/town from …
Lesson Delivery: Students will collect weather data for a given city/town from a weather website to analyze and create a graph that displays the change in temperature over a time period (one or twq weeks). Useful Sites: Create a Graph: https://nces.ed.gov/nceskids/createagraph/Default.aspx Weather Data: https://www.weather.gov/wrh/climate
In presentation mode, teachers and students can review the interactive Data and …
In presentation mode, teachers and students can review the interactive Data and Analysis vocabulary term Slideshow based on the 2017 CS Curriculum Framework glossary of terms for grade 7. Additionally, a quick quiz has been included (Google Forms) for a class assignment or for assessment purposes.
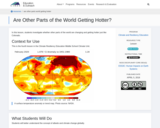
Students are to research a topic and present the topic by either …
Students are to research a topic and present the topic by either trying to convince you one way or another about the topic or leaving you to make your choice.
No restrictions on your remixing, redistributing, or making derivative works. Give credit to the author, as required.
Your remixing, redistributing, or making derivatives works comes with some restrictions, including how it is shared.
Your redistributing comes with some restrictions. Do not remix or make derivative works.
Most restrictive license type. Prohibits most uses, sharing, and any changes.
Copyrighted materials, available under Fair Use and the TEACH Act for US-based educators, or other custom arrangements. Go to the resource provider to see their individual restrictions.