In a multi-week experiment, students monitor the core temperatures of two compost …
In a multi-week experiment, students monitor the core temperatures of two compost piles, one control and one tended, to see how air and water affect microbial activity. They daily aerate and wet the "treated" pile and collect 4-6 weeks' worth of daily temperature readings. Once the experiment is concluded, students plot and analyze their data to compare the behavior of the two piles. They find that the treated pile becomes hotter, an indication that more microbes are active and releasing heat. Through this activity, students see that microbes play a role in composting and how composting can be used as a carbon management process.
Elementary grade students investigate heat transfer in this activity to design and …
Elementary grade students investigate heat transfer in this activity to design and build a solar oven, then test its effectiveness using a temperature sensor. It blends the hands-on activity with digital graphing tools that allow kids to easily plot and share their data. Included in the package are illustrated procedures and extension activities. Note Requirements: This lesson requires a "VernierGo" temperature sensing device, available for ~ $40. This item is part of the Concord Consortium, a nonprofit research and development organization dedicated to transforming education through technology. The Consortium develops digital learning innovations for science, mathematics, and engineering.
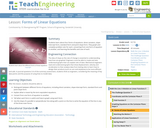
A brief refresher on the Cartesian plane includes how points are written …
A brief refresher on the Cartesian plane includes how points are written in (x, y) format and oriented to the axes, and which directions are positive and negative. Then students learn about what it means for a relation to be a function and how to determine domain and range of a set of data points.
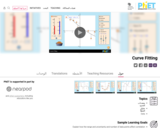
With your mouse, drag data points and their error bars, and watch …
With your mouse, drag data points and their error bars, and watch the best-fit polynomial curve update instantly. You choose the type of fit: linear, quadratic, cubic, or quartic. The reduced chi-square statistic shows you when the fit is good. Or you can try to find the best fit by manually adjusting fit parameters.
The student will use previously collected personal and peer data (Part 1: …
The student will use previously collected personal and peer data (Part 1: Screen Time Logs) to graph a bar and pie graph in Slides using Sheets to graph the data collected.This is the second part of an intended presentation project for a computer CTE middle school class, but can be edited and adapted for any graphing and/or computer integration lessons about bar and pie graphs and how to make them in Google Sheets using Google Slides.
Student teams design and create LEGO® structures to house and protect temperature …
Student teams design and create LEGO® structures to house and protect temperature sensors. They leave their structures in undisturbed locations for a week, and regularly check and chart the temperatures. This activity engages students in the design and analysis aspects of engineering.
In a multi-week experiment, student teams gather biogas data from the mini-anaerobic …
In a multi-week experiment, student teams gather biogas data from the mini-anaerobic digesters that they build to break down different types of food waste with microbes. Using plastic soda bottles for the mini-anaerobic digesters and gas measurement devices, they compare methane gas production from decomposing hot dogs, diced vs. whole. They monitor and measure the gas production, then graph and analyze the collected data. Students learn how anaerobic digestion can be used to biorecycle waste (food, poop or yard waste) into valuable resources (nutrients, biogas, energy).
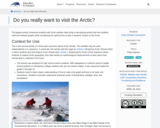
This jigsaw activity introduces students with Arctic weather data using a role-playing …
This jigsaw activity introduces students with Arctic weather data using a role-playing activity that has students read and interpret graphs while considering the optimal time to plan a research mission to the Arctic.
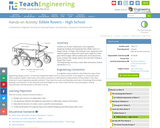
Students act as Mars exploratory rover engineers, designing, building and displaying their …
Students act as Mars exploratory rover engineers, designing, building and displaying their edible rovers to a design review. To begin, they evaluate rover equipment and material options to determine which parts might fit in their given NASA budget. With provided parts and material lists, teams analyze their design options and use their findings to design their rovers.
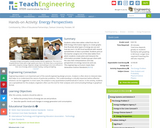
Students utilize data tables culled from the US DOE Energy Information Agency …
Students utilize data tables culled from the US DOE Energy Information Agency to create graphs that illustrate what types of energy we use and how we use it. An MS Excel workbook with several spreadsheets of data is provided. Students pick (or the teacher assigns) one of the data tables from which students create plots and interpret the information provided. Student groups share with the class their interpretations and new perspectives on energy resources and use.
Students will: Predict the kinetic and potential energy of objects Design a …
Students will: Predict the kinetic and potential energy of objects Design a skate park Examine how kinetic and potential energy interact with each other
Learn about graphing polynomials. The shape of the curve changes as the …
Learn about graphing polynomials. The shape of the curve changes as the constants are adjusted. View the curves for the individual terms (e.g. y=bx ) to see how they add to generate the polynomial curve.
Learn about graphing polynomials. The shape of the curve changes as the …
Learn about graphing polynomials. The shape of the curve changes as the constants are adjusted. View the curves for the individual terms (e.g. y=bx ) to see how they add to generate the polynomial curve.
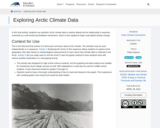
In this activity, students use authentic Arctic climate data to explore albedo …
In this activity, students use authentic Arctic climate data to explore albedo and its relationship to seasonal snowmelt as a self-reinforcing feedback mechanism, which is then applied to large scale global climate change.
Students learn how to use and graph real-world stream gage data to …
Students learn how to use and graph real-world stream gage data to create event and annual hydrographs and calculate flood frequency statistics. Using an Excel spreadsheet of real-world event, annual and peak streamflow data, they manipulate the data (converting units, sorting, ranking, plotting), solve problems using equations, and calculate return periods and probabilities. Prompted by worksheet questions, they analyze the runoff data as engineers would. Students learn how hydrographs help engineers make decisions and recommendations to community stakeholders concerning water resources and flooding.
Students learn about four forms of equations: direct variation, slope-intercept form, standard …
Students learn about four forms of equations: direct variation, slope-intercept form, standard form and point-slope form. They graph and complete problem sets for each, converting from one form of equation to another, and learning the benefits and uses of each.
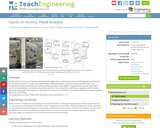
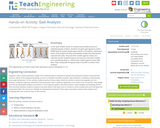
In this open-ended, hands-on activity that provides practice in engineering data analysis, …
In this open-ended, hands-on activity that provides practice in engineering data analysis, students are given gait signature metric (GSM) data for known people types (adults and children). Working in teams, they analyze the data and develop models that they believe represent the data. They test their models against similar, but unknown (to the students) data to see how accurate their models are in predicting adult vs. child human subjects given known GSM data. They manipulate and graph data in Excel® to conduct their analyses.
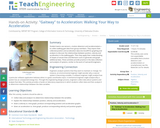
Student teams use sensorsâmotion detectors and accelerometersâto collect walking gait data from …
Student teams use sensorsâmotion detectors and accelerometersâto collect walking gait data from group members. They import their collected position and acceleration data into Excel® for graphing and analysis to discover the relationships between position, velocity and acceleration in the walking gaits. Then they apply their understanding of slopes of secant lines and Riemann sums to generate and graph additional data. These activities provide practice in the data collection and analysis of systems, similar to the work of real-world engineers.
CK-12's Texas Instruments Geometry Student Edition Flexbook is a useful collection of …
CK-12's Texas Instruments Geometry Student Edition Flexbook is a useful collection of exercises intended to enrich a student's understanding of basic geometric principles.
No restrictions on your remixing, redistributing, or making derivative works. Give credit to the author, as required.
Your remixing, redistributing, or making derivatives works comes with some restrictions, including how it is shared.
Your redistributing comes with some restrictions. Do not remix or make derivative works.
Most restrictive license type. Prohibits most uses, sharing, and any changes.
Copyrighted materials, available under Fair Use and the TEACH Act for US-based educators, or other custom arrangements. Go to the resource provider to see their individual restrictions.