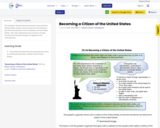
The students will describe the process of becoming a United States citizen …
The students will describe the process of becoming a United States citizen and the reason for the writing of the 14th Amendment to the Constitution of the United States. They will understand how American society has become diverse through immigration and naturalization.
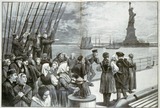
Students will answer the question: Did the American Dream come true for …
Students will answer the question: Did the American Dream come true for immigrants who came to New York? Students will analyze primary and secondary sources, synthesize new information, and answer the compelling question using evidence from the lesson. Students will use interactive simulations, videos, secondary sources, and primary sources as they engage in supporting questions throughout the lesson. By the end of the lesson, students will be able to explain why immigrants chose to emigrate to America, describe the process at Ellis Island, describe life in New York tenements, and explain how immigrants helped shape New York culture.This lesson is adapted from the Immigration Inquiry designed by C3Teachers.org: http://www.c3teachers.org/inquiries/immigration/
In this unit students explore immigration by reading a series of narrative …
In this unit students explore immigration by reading a series of narrative nonfiction and fiction texts that highlight the experiences of early and recent immigrants. In the first part of the unit students are pushed to notice and think about the different reasons people choose to leave their homes and settle in a new community or country. Students will then be pushed to think about the different memories, cultural traits, goods, ideas, languages, and skills that individuals and families bring with them when they move to a new place and how these characteristics enrich the community. While students are exposed to a wide variety of immigrant experiences over the course of the unit, not every experience or feeling about immigration is captured in this unit. Because many of our students are first- or second-generation immigrants, it is crucial to be sensitive to and respect the varying experiences and feelings of our students and families. It is our hope that this unit, in connection with others, will help students build sensitivity and empathy for varying cultures and experiences within the United States.
At all points in its history, a significant proportion of the population …
At all points in its history, a significant proportion of the population of the United States had been born in other countries and regions. This being the case, American history can never be understood by just looking within its borders. The culture and politics of the US have always been profoundly shaped by the material and emotional ties many of its residents have had to the places where they were born. This map will allow you to begin to explore those connections at the basic level of demographic statistics.
Adapted from Davis, Kay. "Pearl S. Buck: 'On Discovering America.'" Retrieved from https://edsitement.neh.gov/lesson-plans/pearl-s-buck-discovering-america
Adapted from Holzer, Madeline Fuchs (2016). “Every Day We Get More Illegal” by …
Adapted from Holzer, Madeline Fuchs (2016). “Every Day We Get More Illegal” by Juan Felipe Herrera. Retrieved from https://edsitement.neh.gov/lesson-plans/every-day-we-get-more-illegal-juan-felipe-herrera.
Bar chart of countries ranked by their net migration flow as of …
Bar chart of countries ranked by their net migration flow as of 2005. While the highest net in-flow is generally into large rich countries (USA, Spain, Germany etc.) Afghanistan had the second highest net inflow thanks to returning refugees.
This Story Map Journal has students analyzing the origins and destinations of …
This Story Map Journal has students analyzing the origins and destinations of immigrants during three main eras of U.S. immigration. Through analysis of migration flows, students will gain a better understanding of why people left their home countries when they did and consider why they settled where they did in the U.S. Finally, students will be asked to consider both history and current events to draft a plan for future U.S. immigration policy. Key questions: Where have immigrants settled in the United States and why? Contains links to student materials and teacher materials for creating lesson plans.What patterns of immigration and settlement are noticeable throughout history? How have Americans viewed immigrants over time? What push and pull factors have influenced migration to and within the U.S.? What should the U.S. do concerning immigration in the future?
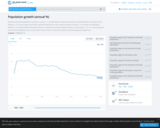
Data set and map pertaining to population growth for all countries as …
Data set and map pertaining to population growth for all countries as an annual percentage. The World Bank specifies population growth as a World Development Indicator (WDI) -- the statistical benchmark that helps measure the progress of development.
In this unit, students begin to explore the complexity of immigration and …
In this unit, students begin to explore the complexity of immigration and immigrant rights by reading the core text Return to Sender. Through the eyes of two children, Return to Sender highlights the challenges of life for Mexican laborers in Vermont and the way in which stereotypes about undocumented workers are formed. Through the eyes of Tyler, the farm owner's son, students witness the internal struggle surrounding what makes something right or wrong, particularly in regard to if the family should hire undocumented workers even though without them the beloved family farm would need to be sold. They also see how the stereotypes Tyler believes about Mexican workers are broken down through his relationships with the Cruz family. Through the eyes of Mari, the daughter of an undocumented worker, students witness the daily challenges and barriers undocumented workers face in the fight for a better life and future. As Tyler and Mari develop a friendship, readers are pushed to think critically about the arguments on both sides of the debate surrounding Mexican and other laborers in Vermont, and the way in which friendships across lines of diffference can help dismantle stereotypes.
It is important to note that the scope of this unit is intentionally narrow. Immigration, particularly undocumented immigration, is an incredibly complex issue. This unit serves as an entry point. It is our hope that this unit begins to humanize a controversial topic and inspires students to question things beyond their own world and fight for their own view of what is right. To build a deeper understanding of the nuances and history of migrant workers in the United States, we recommend that this unit is paired with the social studies unit on Cesar Chavez and the migrant workers' fight for justice and equity.
Students will review the immigration data set and draw conclusions regarding changes …
Students will review the immigration data set and draw conclusions regarding changes in immigration from the 1800s to the early 1900s. Some students may find it easier to compare two decades while others may be able to compare ranges of decades from each century. Once conclusions about changes in immigration have been made, students should identify the reason for the change.
Students will review the immigration data set and draw conclusions regarding changes …
Students will review the immigration data set and draw conclusions regarding changes in immigration from the 1800s to the early 1900s. Some students may find it easier to compare two decades while others may be able to compare ranges of decades from each century. Once conclusions about changes in immigration have been made, students should identify the reason for the change. Students will review the immigration data set and be able to identify where in the world most immigrants came from during specific time periods in history.
Students will review the immigration data set and draw conclusions regarding changes …
Students will review the immigration data set and draw conclusions regarding changes in immigration from the 1800s to the early 1900s. Some students may find it easier to compare two decades while others may be able to compare ranges of decades from each century. Once conclusions about changes in immigration have been made, students should identify the reason for the change.
Remixed to add a few guided questions as conversation starters?
As 3rd grade students have been learning about History SOL 3.13 - …
As 3rd grade students have been learning about History SOL 3.13 - this lesson integrates the content that American people have different ethnic origins and come from different countries (immigration) as well as the reading strategy of reading the author’s words and determining whether the information is directly stated (right there) or inferred based on clues from the author’s words.
No restrictions on your remixing, redistributing, or making derivative works. Give credit to the author, as required.
Your remixing, redistributing, or making derivatives works comes with some restrictions, including how it is shared.
Your redistributing comes with some restrictions. Do not remix or make derivative works.
Most restrictive license type. Prohibits most uses, sharing, and any changes.
Copyrighted materials, available under Fair Use and the TEACH Act for US-based educators, or other custom arrangements. Go to the resource provider to see their individual restrictions.