Your students are archeologists at the Jamestown Settlement. The settlement directors (teachers) would …
Your students are archeologists at the Jamestown Settlement. The settlement directors (teachers) would like to include information on the new website, and the students have been asked to make a program (ie presentation) on settlers first arriving in Jamestown and their first few years there. They must target this program to people who are not familiar with the Jamestown settlement to attract their attention and curiosity to want to see more of the settlement and get them to come visit Jamestown. Their program’s artifact should include pictures of real artifacts, maps, etc to help explain the sequence (ie timeline) of events or tell the story of the beginning of the settlement. They should include a brief explanation with each slide. They will present their presentation to peers who will give feedback as potential visitors to Jamestown.
You have been offered a job with NASA as an astronomy assistant. …
You have been offered a job with NASA as an astronomy assistant. Your first task is to create a digital model and fact sheet about the Earth, moon and sun for future fourth graders at Sealston Elementary. Your audience is current third grade students, and you will be hired to share at a Universe Fair based upon your successful completion of the task.
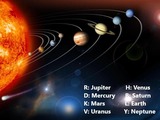
Your task as an astronomer is to model the solar system using …
Your task as an astronomer is to model the solar system using technology. You and your crew are just one group that have been asked by NASA to chart the solar system in order to create a simulation model for future astronauts. After you have accomplished this, you will present your model to the Director of NASA. They have given you several requirements for the simulation. Your simulation should include a map of the solar system that shows the appropriate distance, location, size and relation to the sun amongst the eight planets. You and your team can use a variety of options to complete your simulation. These include Google Suite tools (such as Google Slides, Google Docs, Jamboard, or any equivalent tool such as Microsoft Office), Coding resources (Scratch.edu, tynker.edu) or 3D printing software (Tinkercad) to present. Your map should also include a short descriptive paragraph for each planet explaining its distance, location, size, and at least 3 facts about the planet. If creating a video, you will still want to include descriptions for the planets as well as the three facts. Presentation to “NASA Directors” must answer the question: how does this simulation/model help future scientists?
This is a lesson plan to teach bruteforce and divide and conquer …
This is a lesson plan to teach bruteforce and divide and conquer to elementary students. This lesson plans comes with activities and a quizlet study deck.
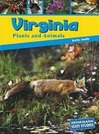
Students will explore Virginia and its border states (Maryland, Kentucky, West Virginia, …
Students will explore Virginia and its border states (Maryland, Kentucky, West Virginia, Tennessee, and North Carolina) then pick one of them to look at data of the monthly average high and low temperatures. Students will collect the data and use it to create a graph in Google Sheets. The graph will have correct titles and labeling. Students will also learn to predict as well as compare and contrast. This lesson integrates well into Social Studies, Math, Language Arts, Science and Computer Science.
Time to show what you know and apply your knowledge of living …
Time to show what you know and apply your knowledge of living systems in this digital ecosystem project. Students will collaborate to research a specific ecosystem using their knowledge from the unit. Students will also create a digital model and representation of their researched North American ecosystem!
Students will use Google Slides to create an artifact that illustrates their …
Students will use Google Slides to create an artifact that illustrates their learning about Harriet Tubman & the Underground Railroad. Slides will include specific components (i.e. video book talk).
Students will be learning how art and engineering intersect by using Tinkercad, …
Students will be learning how art and engineering intersect by using Tinkercad, 3D modeling software, produced by Autodesk, to create a physical, 3d printed, product. In this Tinkercad introduction project, students will produce a text-based keychain.
The website, "app.diagrams.net" is an outstanding site for school children to use …
The website, "app.diagrams.net" is an outstanding site for school children to use for creating diagrams such as flowcharts, organizational charts, or sequencing diagrams.In computer science, websites like this are instrumental for artifact planning and creation which is found in multiple grades in the Algorithms and Programming and Data and Analysis strands.
No restrictions on your remixing, redistributing, or making derivative works. Give credit to the author, as required.
Your remixing, redistributing, or making derivatives works comes with some restrictions, including how it is shared.
Your redistributing comes with some restrictions. Do not remix or make derivative works.
Most restrictive license type. Prohibits most uses, sharing, and any changes.
Copyrighted materials, available under Fair Use and the TEACH Act for US-based educators, or other custom arrangements. Go to the resource provider to see their individual restrictions.