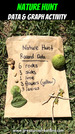
In this lesson students will collect items in nature. They will then …
In this lesson students will collect items in nature. They will then count, graph, and analyze the data they collected. The lesson is set up to use a bar graph, but any graph can be used.
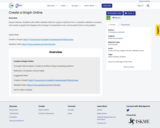
Lesson Delivery: Students will collect weather data for a given city/town from …
Lesson Delivery: Students will collect weather data for a given city/town from a weather website to analyze and create a graph that displays the change in temperature over a time period (one or twq weeks). Useful Sites: Create a Graph: https://nces.ed.gov/nceskids/createagraph/Default.aspx Weather Data: https://www.weather.gov/wrh/climate
Zap, Zap, Zap! Spark your students’ curiosity and illuminate their understanding of …
Zap, Zap, Zap! Spark your students’ curiosity and illuminate their understanding of electromagnet with this captivating resource. Designed to be both informative and engaging, this resource explores the fascinating world of electromagnetism, covering everything from its fundamental concepts to important aspects of electricity safety. Students will have the opportunity to delve into hands-on experiments, using simple materials such as batteries, wires, and nails to create their very own electromagnets. As they witness the power of these electromagnets firsthand, their curiosity will be piqued, fueling their desire to learn more about this incredible phenomenon. The fun doesn't stop there - students will also be able to put their electromagnets to practical use by using them to collect paper clips. To enhance the learning experience, students will then enter the data they collect into a convenient Google spreadsheet, allowing for further analysis and exploration of the results. By the end of this lesson, it is my hope that students will not only have gained a deeper understanding of electromagnetism but also develop a genuine enthusiasm for science and a desire to continue exploring its mysteries.
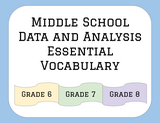
In presentation mode, teachers and students can review the interactive Data and …
In presentation mode, teachers and students can review the interactive Data and Analysis Vocabulary terms Slideshow based on the 2017 CS Curriculum Frame Work glossary of terms for grade 6.Additionally, a quick quiz has been included (Google Forms) for a class assignment or assessment purposes.
In presentation mode, teachers and students can review the interactive Data and …
In presentation mode, teachers and students can review the interactive Data and Analysis vocabulary term Slideshow based on the 2017 CS Curriculum Framework glossary of terms for grade 7. Additionally, a quick quiz has been included (Google Forms) for a class assignment or for assessment purposes.
In presentation mode, teachers and students can review the interactive Data and …
In presentation mode, teachers and students can review the interactive Data and Analysis Vocabulary terms Slideshow based on the 2017 CS Curriculum Framework lessons for grade 8. Additionally, a quick quiz has been included (Google Forms) for a class assignment or for assessment purposes.
Students will explore Virginia and its border states (Maryland, Kentucky, West Virginia, …
Students will explore Virginia and its border states (Maryland, Kentucky, West Virginia, Tennessee, and North Carolina) then pick one of them to look at data of the monthly average high and low temperatures. Students will collect the data and use it to create a graph in Google Sheets. The graph will have correct titles and labeling. Students will also learn to predict as well as compare and contrast. This lesson integrates well into Social Studies, Math, Language Arts, Science and Computer Science.
Students will be given bar graphs and pie charts. They will need …
Students will be given bar graphs and pie charts. They will need to match the correct bar chart with the pie chart. The pie charts are fraction representations of the bar graphs. Pie charts and length models broken into halves, thirds, fourths, sixths, and eighths are provided to help students see the fractional models. All items are provided online. There are a total of 4 different models: Favorite Animal, Favorite Color, Favorite Food, and Favorite Fruit
Students are to research a topic and present the topic by either …
Students are to research a topic and present the topic by either trying to convince you one way or another about the topic or leaving you to make your choice.
The student will use a table of personal data collected about plugged/unplugged …
The student will use a table of personal data collected about plugged/unplugged activites and times of rest throughout the period of one week (7 days) to document screen times in comparison to active and restful breaks for a computer science integration and digital balance project.This Part 1 activity uses the data collected in a table to teach students how to copy and paste a table from Docs into Slides, and how to develop a Slideshow Presentation with tables (Part 1) and graphs (Part 2). Students are given opportunities to collect and analyze data, to enter information into tables and graphs, to develop and share presentations in Slides, as well as summarize and draw conclusions about the data collection, graphing, and results as comparable to their peers, digital categories, or peer groups (Gamers vs YouTubers, Boys vs Girls, etc.).The goal/s of this unit is to help students realize the importance of living a digitally balanced life and to help students develop skills for creating and using digital tables and graphs with an introduction to data collection and analysis.
The student will use previously collected personal and peer data (Part 1: …
The student will use previously collected personal and peer data (Part 1: Screen Time Logs) to graph a bar and pie graph in Slides using Sheets to graph the data collected.This is the second part of an intended presentation project for a computer CTE middle school class, but can be edited and adapted for any graphing and/or computer integration lessons about bar and pie graphs and how to make them in Google Sheets using Google Slides.
Data Science is a growing field across all disciplines and grade levels. …
Data Science is a growing field across all disciplines and grade levels. Use the assets in this collection to help learn valuable skills and concepts related to collecting, using, analyzing, and presenting data. The VDOE, Data Science Teachers, and WHRO Education collaboratively created this content.
Students will research one of the seven federally recognized tribes of Native …
Students will research one of the seven federally recognized tribes of Native Americans in Virginia to identify local features of the land, their language, the region of Virginia where they originally lived, where the tribal lands are today, and how they interacted with their environment. From this research, the student groups will design a visualization of this data using a poster, online design tool, or a presentation. Student groups will present their information to each other, and the classroom will design a chart to find similarities and differences between the tribes.
This activity allows for students to Identify the quantitative and qualitative benefits of …
This activity allows for students to Identify the quantitative and qualitative benefits of going to collegeUnderstand common costs associated with collegeExplain the difference between sticker price and net price
Overview of the activity:The students will sort and graph the items given …
Overview of the activity:The students will sort and graph the items given to them and discuss the way they are sorted. They will then complete a graph of the items, and then we will construct and build with the items and explain what they build and how tall it is.
No restrictions on your remixing, redistributing, or making derivative works. Give credit to the author, as required.
Your remixing, redistributing, or making derivatives works comes with some restrictions, including how it is shared.
Your redistributing comes with some restrictions. Do not remix or make derivative works.
Most restrictive license type. Prohibits most uses, sharing, and any changes.
Copyrighted materials, available under Fair Use and the TEACH Act for US-based educators, or other custom arrangements. Go to the resource provider to see their individual restrictions.