With digitization, we see biosecurity, cybersecurity, and physical security begin to overlap. …
With digitization, we see biosecurity, cybersecurity, and physical security begin to overlap. This overlap started a new discipline, cyberbiosecurity. This resource is part of the Agricultural Cyberbiosecurity Education Resource Collection that contains resources for formal and non-formal agricultural educators working with middle school aged youth. Published as Open Educational Resources, all resources are provided in durable (pdf) and customizable (MS Word) formats. They are hosted on GoOpenVA in a unique resource collection, Ag Cybersecurity Virginia Tech, at https://goopenva.org/curated-collections/143 and on on Virginia Tech’s stable repository, VTechWorks at https://doi.org/10.21061/cyberbiosecurity
Data makes the world go around! As we use more technology, more …
Data makes the world go around! As we use more technology, more data is being created, recorded, and used. The next task is understanding what it all means!This resource is part of the Agricultural Cyberbiosecurity Education Resource Collection that contains resources for formal and non-formal agricultural educators working with middle school aged youth. Published as Open Educational Resources, all resources are provided in durable (pdf) and customizable (MS Word) formats. They are hosted on GoOpenVA in a unique resource collection, Ag Cybersecurity Virginia Tech, at https://goopenva.org/curated-collections/143 and on on Virginia Tech’s stable repository, VTechWorks at https://doi.org/10.21061/cyberbiosecurity
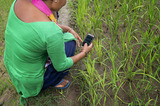
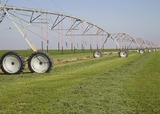
Farming is not just a farmer driving a tractor anymore. Sometimes the …
Farming is not just a farmer driving a tractor anymore. Sometimes the tractor drives itself! Agriculture is very technological and part of that effort is precision agriculture. Learn about how farmers are using technology to optimize their farms. This resource is part of the Agricultural Cyberbiosecurity Education Resource Collection that contains resources for formal and non-formal agricultural educators working with middle school aged youth. Published as Open Educational Resources, all resources are provided in durable (pdf) and customizable (MS Word) formats. They are hosted on GoOpenVA in a unique resource collection, Ag Cybersecurity Virginia Tech, at https://goopenva.org/curated-collections/143 and on on Virginia Tech’s stable repository, VTechWorks at https://doi.org/10.21061/cyberbiosecurity
In small groups, students will be assigned two of the first ten …
In small groups, students will be assigned two of the first ten amendments and pose the questions, “Which of these two amendments do you think is more important?” and “Why do you believe this?” in a survey of ten classmates. Then they will collect and organize the data electronically to create two visual representations of their information. Students will add their raw data and visualizations to a shared slideshow to present their findings to the class and explain why they chose this particular visualization model and what conclusions they can draw from their survey responses.This material is based upon work supported by the National Science Foundation under Grant No. 2010256.Any opinions, findings, and conclusions or recommendations expressed in this material are those of the author(s) and do not necessarily reflect the views of the National Science Foundation.
Students analyze a chart with the characteristics of the three colonial regions …
Students analyze a chart with the characteristics of the three colonial regions and determine a better way to visualize the information that shows the similarities and differences between the three.This material is based upon work supported by the National Science Foundation under Grant No. 2010256.Any opinions, findings, and conclusions or recommendations expressed in this material are those of the author(s) and do not necessarily reflect the views of the National Science Foundation.
Students will gather information regarding the cultural and economic interactions between Europeans …
Students will gather information regarding the cultural and economic interactions between Europeans and American Indians during Westward Expansion. Students will work in groups to analyze several primary sources and create a visual representation depicting the Native vs. European perspectives of westward expansion.
This lesson is part of the Virginia K-12 Computer Science Pipeline which is partly …
This lesson is part of the Virginia K-12 Computer Science Pipeline which is partly funded through a GO Virginia grant in partnership with Chesapeake Public Schools, Loudoun County Public Schools, and the Loudoun Education Foundation. During this lesson, students will create a simulation of Earth's Enegy Budget using Scratch.
This lesson is part of the Virginia K-12 Computer Science Pipeline which is partly …
This lesson is part of the Virginia K-12 Computer Science Pipeline which is partly funded through a GO Virginia grant in partnership with Chesapeake Public Schools, Loudoun County Public Schools, and the Loudoun Education Foundation. In this lesson, students will create isotherms and isobars on weather maps.
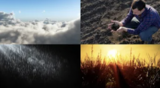
NASA eClips Real World: Food Security -- Monitoring Crops from SpaceVideo Description: Discover …
NASA eClips Real World: Food Security -- Monitoring Crops from SpaceVideo Description: Discover how NASA's Earth-observing satellites gather data to monitor food growth. Dr. Inbal Becker-Reshef describes how mathematics is used to interpret satellite data and describe vegetation and crop yield. Dr. Hannah Kerner shares how algorithms and models use NASA data to describe and predict food supply and food shortages. This work through NASA Harvest provides tools for farmers and governments to describe and predict food security worldwide. Video Length: 5:25.NASA eClipsTM is a suite of online student-centered, standards-based resources that support instruction by increasing STEM literacy in formal and nonformal settings. These free digital and downloadable resources inform and engage students through NASA-inspired, real-world connections.NASA eClips Real World segments (grades 6-8) connect classroom mathematics to 21st Century careers and innovations. They are designed for students to develop an appreciation for mathematics through real-world problem solving.
This lesson is part of the Virginia K-12 Computer Science Pipeline which is partly …
This lesson is part of the Virginia K-12 Computer Science Pipeline which is partly funded through a GO Virginia grant in partnership with Chesapeake Public Schools, Loudoun County Public Schools, and the Loudoun Education Foundation. During this lesson, students will create a timeline of space exploration.
Students are practicing using Scratch programming to program microbit sensors to continually …
Students are practicing using Scratch programming to program microbit sensors to continually read temperature. Doing this will familiarize students with the Scratch programming software to program TDS and Temperature sensors for the fishtank in the hallway.
Students will learn about treaties and what important role they have played …
Students will learn about treaties and what important role they have played in with Virginia’s Native Americans. They will learn why there are treaties and how they affected the tribes and the Europeans and where they stand in the 21st century. In the second lesson, the teacher will go through the slides with the students explaining what was agreed between the Natives in Virginia and the Europeans that came to their land. This lesson can last as long as it takes to get through the slides, or the teacher can pick some of the agreements and discuss with students.
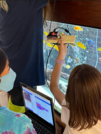
This activity will ask students to locate geographic regions and features on …
This activity will ask students to locate geographic regions and features on a class map using longitude and latitude measurements. Using the longitude and latitude data, students will be able to visualize geographic features in the actual location in order to analyze the living conditions of various regions.This material is based upon work supported by the National Science Foundation under Grant No. 2010256.Any opinions, findings, and conclusions or recommendations expressed in this material are those of the author(s) and do not necessarily reflect the views of the National Science Foundation.
Students will apply their knowledge of the characteristics of the five major …
Students will apply their knowledge of the characteristics of the five major regions to create if-statements. As a warm-up students will complete a table using IF statements.During student-facing project, students will:Create 2-3 additional variables within the conditions chart that will direct the flow to determine the correct region.Record responses provided by their partner on an excel spreadsheet.Students will use responses provided to draw a conclusion of which region their partner is “located”.
In this lesson, students will organize and visualize data from indentured contract …
In this lesson, students will organize and visualize data from indentured contract databases from virtualjamestown.org in order to come to some conclusions about the characteristics of indentured servants in early colonial America. They will make specific decisions about how to organize the data and how to best visualize the data. They will then use the data to draw conclusions about indentured servants in early colonial Virginia, culminating in a creative journal entry assignment. Additional lessons can have students search for and analyze data on the enslaved Africans of early colonial Virginia in order to compare and contrast the two forms of labor in colonial Virginia.
Students will sort and analyze data about a historical figure from the …
Students will sort and analyze data about a historical figure from the American Revolution then create a desk depicting the accomplishments, life events and/or experiences, positive and negative of the historical figure of that individual. Students will work in heterogeneous groups on a project where they sort data and analyze data about a historical figure during the American Revolution. Students will use the data collected to create a depiction of the historical figure’s desk.
No restrictions on your remixing, redistributing, or making derivative works. Give credit to the author, as required.
Your remixing, redistributing, or making derivatives works comes with some restrictions, including how it is shared.
Your redistributing comes with some restrictions. Do not remix or make derivative works.
Most restrictive license type. Prohibits most uses, sharing, and any changes.
Copyrighted materials, available under Fair Use and the TEACH Act for US-based educators, or other custom arrangements. Go to the resource provider to see their individual restrictions.