Updating search results...

Search Resources

14 Results

View
Selected filters:
  • VA.MTH.8.16.a - The student will recognize and describe the graph of a linear function...
8.F Heart Rate Monitoring
Conditional Remix & Share Permitted
CC BY-NC-SA
Rating
0.0 stars

This is a task from the Illustrative Mathematics website that is one part of a complete illustration of the standard to which it is aligned. Each task has at least one solution and some commentary that addresses important asects of the task and its potential use. Here are the first few lines of the commentary for this task: Serena is starting a new workout routine and wants to keep track of her heart rate to make sure that she is exercising at the optimum level. First she ...

Subject:
Mathematics
Material Type:
Activity/Lab
Provider:
Illustrative Mathematics
Author:
Illustrative Mathematics
Date Added:
05/17/2013
Grade 8 Module 4: Linear Equations
Conditional Remix & Share Permitted
CC BY-NC-SA
Rating
0.0 stars

In Module 4, students extend what they already know about unit rates and proportional relationships to linear equations and their graphs. Students understand the connections between proportional relationships, lines, and linear equations in this module. Also, students learn to apply the skills they acquired in Grades 6 and 7 with respect to symbolic notation and properties of equality to transcribe and solve equations in one variable and then in two variables.
To access this resource, you will need to create a free account for the system on which it resides. The partner provides personalized features on their site such as bookmarking and highlighting which requires a user account.

Subject:
Mathematics
Material Type:
Module
Provider:
Eureka Math (Great Minds)
Date Added:
11/19/2019
Graphing Linear Functions (Math SOL 8th)
Conditional Remix & Share Permitted
CC BY-NC-SA
Rating
0.0 stars

This task requires students to use the fact that on the graph of the linear function h(x)=ax+b, the y-coordinate increases by a when x increases by one. Specific values for a and b were left out intentionally to encourage students to use the above fact as opposed to computing the point of intersection, (p,q), and then computing respective function values to answer the question. The Virginia Department of Education resource titled, "Graphing Linear Functions," which requires students to graph equations in y=mx + b form includes a template and lesson plan.
Subject:
Mathematics
Material Type:
Activity/Lab
Homework/Assignment
Date Added:
11/08/2019
Graphing and Slope CS Integrated Lesson
Unrestricted Use
CC BY
Rating
0.0 stars

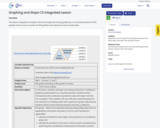
This lesson integrates computer science through discovering graphing on a coordinate plane for 6th graders all the way to a review for 8th graders with extensions that include slope.

Subject:
Algorithms and Programming
Measurement and Geometry
Number and Number Sense
Material Type:
Activity/Lab
Assessment
Homework/Assignment
Lesson
Lesson Plan
Simulation
Author:
KAYLA NUSSMAN
Date Added:
08/18/2021
Heart Rate Monitoring (VA - 8th)
Conditional Remix & Share Permitted
CC BY-SA
Rating
0.0 stars

Students will explore the "story" that can be interpreted from graphs. Graphical representations can be created by looking at videos of different situations on Desmos. After noticing that all types of linear slopes (zero, positive, and negative) can be included in a given situation, students create a graphical representation to show a change in heart rate overtime.

Subject:
Algebra I & II
Mathematics
Patterns, Functions, and Algebra
Material Type:
Activity/Lab
Interactive
Lesson Plan
Module
Simulation
Visual Media
Date Added:
11/12/2019
Identifying slope-intercept form and graphing (Math SOL 8th)
Conditional Remix & Share Permitted
CC BY-NC-SA
Rating
0.0 stars

In this task, we are given the graph of two lines including the coordinates of the intersection point and the coordinates of the two vertical intercepts, and are asked for the corresponding equations of the lines. It is a very straightforward task that connects graphs and equations and solutions and intersection points. The students will use a VDOE resource to recognize and describe the graph of a linear function (foldables, bingo game, lesson plan for the teacher).

Subject:
Mathematics
Patterns, Functions, and Algebra
Material Type:
Activity/Lab
Game
Homework/Assignment
Lesson Plan
Teaching/Learning Strategy
Date Added:
11/08/2019
Linear Functions
Conditional Remix & Share Permitted
CC BY-NC-SA
Rating
0.0 stars

This task requires students to use the fact that on the graph of the linear function h(x)=ax+b, the y-coordinate increases by a when x increases by one. Specific values for a and b were left out intentionally to encourage students to use the above fact as opposed to computing the point of intersection, (p,q), and then computing respective function values to answer the question.

Subject:
Mathematics
Material Type:
Activity/Lab
Provider:
Illustrative Mathematics
Author:
Illustrative Mathematics
Date Added:
05/01/2012
Paying the Rent
Conditional Remix & Share Permitted
CC BY-NC-SA
Rating
0.0 stars

This simple conceptual task focuses on what it means for a number to be a solution to an equation, rather than on the process of solving equations.

Subject:
Mathematics
Material Type:
Activity/Lab
Provider:
Illustrative Mathematics
Author:
Illustrative Mathematics
Date Added:
05/01/2012
Roller Coaster Slope Exploration Activity: Numerical value (Math-7th, 8th, Algebra 1)
Conditional Remix & Share Permitted
CC BY-NC-SA
Rating
0.0 stars

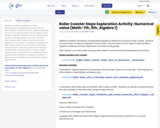
Objective: Students will explore counting boxes/squares to identify the numerical value of slope. Students must know the four types of slope prior to this activity. They will review the four types of slope (positive, negative, undefined, and zero slope) prior to visually counting slope.Note: Teacher must find a video showing roller coaster movement and have prepared for this activity.
The Extension activities are a VDOE Virginia Department of Education Slope and y-intercept resource with bingo game, link to teacher-made foldable, and lesson plan as well as a Drexel University mini- lesson plan with an additional roller coaster activity. Students can identify coordinate points and use materials to calculate slope using the slope formula.
Subject:
Mathematics
Material Type:
Activity/Lab
Homework/Assignment
Lesson Plan
Date Added:
11/10/2019
Roller Coaster Slope Exploration Activity: Numerical value (Math-7th, 8th, Algebra 1)
Conditional Remix & Share Permitted
CC BY-NC-SA
Rating
0.0 stars

Objective: Students will explore counting boxes/squares to identify the numerical value of slope. Students must know the four types of slope prior to this activity. They will review the four types of slope (positive, negative, undefined, and zero slope) prior to visually counting slope.Note: Teacher must find a video showing roller coaster movement and have prepared for this activity.
The Extension activities are a VDOE Virginia Department of Education Slope and y-intercept resource with bingo game, link to teacher-made foldable, and lesson plan as well as a Drexel University mini- lesson plan with an additional roller coaster activity. Students can identify coordinate points and use materials to calculate slope using the slope formula.

Subject:
Mathematics
Material Type:
Activity/Lab
Homework/Assignment
Lesson Plan
Date Added:
05/12/2020
Slope and y-intercept
Conditional Remix & Share Permitted
CC BY-NC
Rating
0.0 stars

Recognize and describe the graph of a linear function.Mathematics Instructional Plans (MIPs) help teachers align instruction with the Mathematics Standards of Learning (SOL) by providing examples of how the knowledge, skills and processes found in the SOL and curriculum framework can be presented to students in the classroom.

Subject:
Mathematics
Material Type:
Lesson Plan
Author:
Virginia Hodge
Tina Mazzacane
Kristin Williams
Date Added:
04/17/2020
Two Lines
Conditional Remix & Share Permitted
CC BY-NC-SA
Rating
0.0 stars

In this task, we are given the graph of two lines including the coordinates of the intersection point and the coordinates of the two vertical intercepts, and are asked for the corresponding equations of the lines. It is a very straightforward task that connects graphs and equations and solutions and intersection points.

Subject:
Mathematics
Material Type:
Activity/Lab
Provider:
Illustrative Mathematics
Author:
Illustrative Mathematics
Date Added:
05/01/2012