
This is a power point lesson that goes through what binary numbers are and how to convert from binary to decimal and vice versa.
- Subject:
- Data and Analysis
- Material Type:
- Activity/Lab
- Author:
- Kimberly Emory
- Date Added:
- 05/24/2022

This is a power point lesson that goes through what binary numbers are and how to convert from binary to decimal and vice versa.

In this lesson, students will create a binary art representation of their names. This will reinforce the concept of using numbers to represent non-numeric ideas.

This Edpuzzle assignment uses a clip from the YouTube video "Binary Numbers for Kids" by Socratica Kids to ask questions for understanding about binary numbers.

This is a lesson plan to teach bruteforce and divide and conquer to elementary students. This lesson plans comes with activities and a quizlet study deck.

This activity will show the sorting process using the Bubble Sort Brute Force algorithm that is used by a computer when sorting data without using a computer.
This is a lesson plan where students will collect data using a survey, record their findings using a pictograph, and make predictions about their findings. This is from the essential knowledge of the Comptuer Science standard 2.11.
This is a lesson plan designed for instructors in which students conduct research on the town they live in, share their findings on Google Jamboard with their classmates, and organize their findings into a chart on Google Sheets in order to make predictions about the data.
This is a lesson plan based on the Computer Science standard, 2.12, where students will create a model. The students will visit a website first to see how a digital model looks and then will create their own digital models of the solar system by using Google Jamboard.
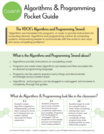
These Pocket Guides are a quick summary of each of the 6 computer science strands for grades K-8. The pocket guides explain what the strand is about and how it increases in complexity from Kindergarten to 8th grade.
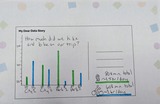
Inspired by Dear Data, a book that highlights a year-long data drawing project between two friends, this activity helps students go through the process of telling a story with their own data by formulating a question, collecting the data, analyzing the data, and interpreting and communicating their story.
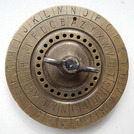
This unplugged lesson will allow students to encrypt and decrypt message using the Caesar Cipher letter shift method of encryption. Cover the process of how this method works by doing an example and explaining the process of shifting the plaintext by the letter shift value to create the encrypted cipher text.

In this lesson students will practice computing the average or mean of 3 or more menu prices or numbers with decimals.

Teacher Instructs the student to navigate to Google.com. The teacher will model researching their career by typing in the search box, “What is the average salary for a teacher in Virginia.” The teacher will ask what does average salary mean and add details to the students’ responses. The teacher will then pull up the Google Sheet to be used for today’s lesson. Students will begin researching their own career choice by typing, “What is the average salary of a _______________________ in VIrginia? The students will find a low, average, and top salary for their career choices. The students will use the average or middle salary given. If more than one average is given the students will use the mathematical equation for finding the mean to calculate the average of the salaries given.

Students will lead discussion on their net pay for their chosen career, their total expenses, and the amount they will have left after paying all the monthly expenses. If there wasn’t enough money to pay all their expenses what will they need to do?

Students will research the cost of homes and expences associated with owning a home. This proccess will help the studet to determine if thier chosen salary will support the purchase of the selected home.

Students will pretend they have a family of 4. Use the list given by students and make sure the following are included: average cost of groceries for a family of 4average cost of health insurance for a family of 4average cost of dining out for a family of 4 (multiply this by 4 for eating out once a week)average monthly internet feeaverage monthly cable or satellite

The teacher will lead discussion on cost of the vehicle versus the salary made for his/her career. What are the pros and cons of this vehicle? Students will then research the type of vehicle they want. Each student will determine the cost of the vehicle. Students will share with each other the type of vehicle they chose, the cost of the vehicle, and the pros and cons of the vehicle.
Students will play the Game “Cheese Chase” where they learn about moving horizontally and vertically on a grid, which will be followed up by a variety of 40 gameboards where the students learn about naming cells in a spreadsheet. There are five activities where the students make bar graphs after interpreting data from a spreadsheet.

Students will read a passage, extract useful and meaningful data, organize and clean the data, and finally represent the data as a graph. Using the following site:https://nces.ed.gov/nceskids/createagraph/6.8 The student will use computational tools to collect, organize, and clean data to make it more useful and reliable.
Introducing Data collection and Analysis:
This activity include a data collection sheet and questions to analyze the data.
The activity can be done as a whole group, small group, or by individual students.
Estimated time from start to finish is 30-45 minutes based on prior knowledge.