These slides contain the vocabulary from the Virginia Department of Education for this strand.
- Subject:
- Data and Analysis
- Material Type:
- Lecture Notes
- Author:
- Erika Coble
- Date Added:
- 06/27/2022

These slides contain the vocabulary from the Virginia Department of Education for this strand.

Explore science while inputting data into a google form to chart results! Students will get to investigate electrical voltage with meters. The student will answer a question by using a computer to manipulate data in order for the student to draw conclusions and make predictions.

In this activity, participants plan and conduct a plant growth experiment while considering the role of data quality in automated systems in agriculture. The timing of the activity is highly dependent on the seed variety that you are growing and the level of familiarity that participants already have with basic plant science and scientific investigation concepts, but will likely take several weeks. This activity is part of the Agricultural Cyberbiosecurity Education Resource Collection that contains resources for formal and non-formal agricultural educators working with middle school aged youth. Published as Open Educational Resources, all resources are provided in durable (pdf) and customizable (MS Word) formats. They are hosted on GoOpenVA in a unique resource collection, Ag Cybersecurity Virginia Tech, at https://goopenva.org/curated-collections/143 and on on Virginia Tech’s stable repository, VTechWorks at https://doi.org/10.21061/cyberbiosecurity

From welding and paint simulators to virtually designing and creating parts for ships, this video explores how the Newport News Shipbuilding Apprentice School incorporates computer modeling and simulations to give apprentices hands-on experience in a safe and clean environment.

On this episode we travel to Henrico County to visit with Yvette Lee of J.R. Tucker High School. Mrs. Lee is a finalist for the 2023 Presidential Award for Math and Science Teaching sponsored by the White House and the National Science Foundation. She talked about the challenges of learning how to teach American students after leaving South Korea. We also caught up with Louisa County Technology Coach Nikki Wagoner at the 2023 VSTE Conference in Roanoke.

Suffolk Public Schools is the host of an annual robotics challenge sponsored by Penn State and the US Department of Defense. ActiVAtED Learning Host Tom Landon traveled to Suffolk to talk to Christine Lafferty and John Littlefield to learn more.
In this activity, students will explore the idea of “data” and how it provides a lens through which to view different aspects of human experience. Students will interrogate the affordances and constraints of data as a form of representation and speculate about the effects data can have on human perception and behavior by fitting data into different schemata, developing their own data schemata, and comparing the data schemata of different institutions in their lives with the schemata they develop to represent themselves.
In this project, students will create artistic data representations, expressive artifacts based on data sets. Before engaging in their own projects, students will briefly research and discuss data-based art making in history and in contemporary times. Then, students will use the remaining 3 instructional days to create their art. The resources below provide support for two kinds of representational projects—data-based music, and data-based visual art on a grid (similar to the weaving art discussed in ECS 1.11-14).
In this lesson, students will learn about using binary encoding to represent numbers and text. They’ll use several different encoding techniques, and then develop and test their own protocol for encoding other kinds of information into binary.
In this extension, students will evaluate the role of data collection in their lives. They’ll identify some common data collection practices, evaluate the ethics of those practices, and develop a framework for thinking about when data collection is appropriate and when it is exploitative.
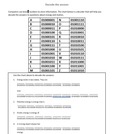
Binary is a way of representing information using only two options.Binary uses a series of 0 and 1 to represent information. In this activity, students will use a chart that converts binary numbers to alphabetic characters. This activity incorporates decoding of binary code into letters to answer questions related to energy and motion.
In small groups, students will be assigned two of the first ten amendments and pose the questions, “Which of these two amendments do you think is more important?” and “Why do you believe this?” in a survey of ten classmates. Then they will collect and organize the data electronically to create two visual representations of their information. Students will add their raw data and visualizations to a shared slideshow to present their findings to the class and explain why they chose this particular visualization model and what conclusions they can draw from their survey responses.This material is based upon work supported by the National Science Foundation under Grant No. 2010256.Any opinions, findings, and conclusions or recommendations expressed in this material are those of the author(s) and do not necessarily reflect the views of the National Science Foundation.

Explore data collection and graphing with this hands-on sensory bin activity!

Interpret graphs and data collection to create a bar/chart graph in Google Slides.

A simple To Do list created in Python using a while loop.

Demonstrate Google Search tips and tricks Using “ “ around a search term to tell Google the results must include the words inside the quotation marksUsing - in the search term to tell google to exclude something from the results ex. search apple -fruit will give results about apple the company with out any results about apple the fruit.Using site: to search with in a particular website you have deemed creditable. ex. search site: www.cnn.com Use OR to search for either one search term or another ex. search climate change or global warming
Vocabulary posters for the Data & Analysis strand for Grade 5. Words included are from the 2017 Computer Science Curriculum Framework.
Vocabulary posters for the Data & Analysis strand for Grade 6. Words included are from the 2017 Computer Science Curriculum Framework.
Vocabulary posters for the Data & Analysis strand for Grade 7. Words included are from the 2017 Computer Science Curriculum Framework.

Organizing and graphing data connects well with our math standards. Students are constantly collecting data without even realizing it. Often students will say “Raise your hand if you like Spiderman” or something similar. By completing the activities contained in this lesson plan, students can take topics that they are interested in and collect more data to analyze. The first activity gets students up and moving. They can immediately see how their peers feel about a topic. Using that data to create graphs will help students to better connect to the data and become invested in the results. The lesson could be modified to support English Language Learners and students with disabilities by providing data sets with fewer responses and providing scaffolding for creating their graphs. Question stems could also be provided to help students write questions about their graphs. The lesson could be extended by providing students with the opportunity to use a graphing program to create their graphs digitally.