Slope Discovery Power Point Activity by C. Hogan Virginia Department of Education …
Slope Discovery Power Point Activity by C. Hogan Virginia Department of Education resource titled, "Slope Discovery," which is an activity resource in which the student will determine slope, write the equation in slope-intercept form, and graph a line.
Students lean about proportions, ratios, and unit rate. It is important for …
Students lean about proportions, ratios, and unit rate. It is important for connections to be made among ratio tables, graphing points, and slope of a line. Students make these connections through the first activity provided by the VDOE. The second task by Illustrative Mathematics is a way to assess student understanding.
This is a remix of Color Week from Illustrative Mathematics, https://tasks.illustrativemathematics.org/content-standards/tasks/1110. The purpose …
This is a remix of Color Week from Illustrative Mathematics, https://tasks.illustrativemathematics.org/content-standards/tasks/1110. The purpose of this activity is to give students practice in collecting data and answering questions related to the gathered data that is displayed in a picture graph to support sol K.11a and K.11b. Students wear a different color shirt each week to represent the color of the week, collect the data by coloring a shirt, place it on the graph, and count how many were worn of that color.
Students compare slope as it relates to distance vs. time. Using a …
Students compare slope as it relates to distance vs. time. Using a simulation on Desmos, students find that faster speeds create steeper slopes on a graph.
Students will identify the parts of the coordinate plane and graph ordered …
Students will identify the parts of the coordinate plane and graph ordered pairs in all four quadrants of the coordinate plane. There are strategies embedded within the handout to support an enduring understanding. For example, in order to plot points, you can use an Elevator relation: Choose the door "x", then the floor "y") Extension: Virginia Department of Education resource document titled, "Coordinate Plane", which is a remediation lesson. Students identify, and graph ordered pairs in the four quadrants of a coordinate plane. Visual aid handout, exit ticket, and lesson plan are included.
Exploring data collection and graphing -- Mathematics Instructional Plans (MIPs) help teachers align …
Exploring data collection and graphing -- Mathematics Instructional Plans (MIPs) help teachers align instruction with the 2016 Mathematics Standards of Learning (SOL) by providing examples of how the knowledge, skills and processes found in the SOL and curriculum framework can be presented to students in the classroom.
This video is part of the Learn and Grow with WHRO TV …
This video is part of the Learn and Grow with WHRO TV series. Watch Xenia Clare teach about interpreting and analyzing data on a bar graph and pictograph.
This is an exploratory activity. Students should have some prior knowledge of …
This is an exploratory activity. Students should have some prior knowledge of evaluating functions for given domain inputs using function notation.This lesson will walk students through using a table and plotting points. By the end of the lesson students should walk away understanding that a line is infinitely many points.
In this task, we are given the graph of two lines including …
In this task, we are given the graph of two lines including the coordinates of the intersection point and the coordinates of the two vertical intercepts, and are asked for the corresponding equations of the lines. It is a very straightforward task that connects graphs and equations and solutions and intersection points. The students will use a VDOE resource to recognize and describe the graph of a linear function (foldables, bingo game, lesson plan for the teacher).
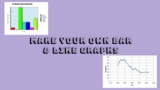
Students will read and interpret data then create one bar graph and one …
Students will read and interpret data then create one bar graph and one line graph.To extend the lessson, students can construct questions that align with the data from each type pf graph.
NASA eClips Real World: Food Security -- Monitoring Crops from SpaceVideo Description: Discover …
NASA eClips Real World: Food Security -- Monitoring Crops from SpaceVideo Description: Discover how NASA's Earth-observing satellites gather data to monitor food growth. Dr. Inbal Becker-Reshef describes how mathematics is used to interpret satellite data and describe vegetation and crop yield. Dr. Hannah Kerner shares how algorithms and models use NASA data to describe and predict food supply and food shortages. This work through NASA Harvest provides tools for farmers and governments to describe and predict food security worldwide. Video Length: 5:25.NASA eClipsTM is a suite of online student-centered, standards-based resources that support instruction by increasing STEM literacy in formal and nonformal settings. These free digital and downloadable resources inform and engage students through NASA-inspired, real-world connections.NASA eClips Real World segments (grades 6-8) connect classroom mathematics to 21st Century careers and innovations. They are designed for students to develop an appreciation for mathematics through real-world problem solving.
Let’s graph our favorite holiday and learn about each other! This lesson …
Let’s graph our favorite holiday and learn about each other! This lesson introduces holidays and then allows children to choose their favorite and graph that information as a whole class.
Objective: Students will explore counting boxes/squares to identify the numerical value of …
Objective: Students will explore counting boxes/squares to identify the numerical value of slope. Students must know the four types of slope prior to this activity. They will review the four types of slope (positive, negative, undefined, and zero slope) prior to visually counting slope.Note: Teacher must find a video showing roller coaster movement and have prepared for this activity. The Extension activities are a VDOE Virginia Department of Education Slope and y-intercept resource with bingo game, link to teacher-made foldable, and lesson plan as well as a Drexel University mini- lesson plan with an additional roller coaster activity. Students can identify coordinate points and use materials to calculate slope using the slope formula.
This google slides activity provides students practice for solving and graphing one …
This google slides activity provides students practice for solving and graphing one step inequalitites. Students will think about the solutions for problems that inlude misconceptions about inequalities.
No restrictions on your remixing, redistributing, or making derivative works. Give credit to the author, as required.
Your remixing, redistributing, or making derivatives works comes with some restrictions, including how it is shared.
Your redistributing comes with some restrictions. Do not remix or make derivative works.
Most restrictive license type. Prohibits most uses, sharing, and any changes.
Copyrighted materials, available under Fair Use and the TEACH Act for US-based educators, or other custom arrangements. Go to the resource provider to see their individual restrictions.