This is a lesson plan where students will collect data using a …
This is a lesson plan where students will collect data using a survey, record their findings using a pictograph, and make predictions about their findings. This is from the essential knowledge of the Comptuer Science standard 2.11.
Students will be given bar graphs and pie charts. They will need …
Students will be given bar graphs and pie charts. They will need to match the correct bar chart with the pie chart. The pie charts are fraction representations of the bar graphs. Pie charts and length models broken into halves, thirds, fourths, sixths, and eighths are provided to help students see the fractional models. All items are provided online. There are a total of 4 different models: Favorite Animal, Favorite Color, Favorite Food, and Favorite Fruit
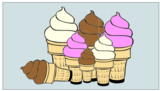
This is a data collection, prediction, and graphing activity using three flavors …
This is a data collection, prediction, and graphing activity using three flavors of ice cream as the subject. It is a ready-made lesson with a Google Slideshow that has all of the activities built into it.
This lesson is part of the Virginia K-12 Computer Science Pipeline which is partly …
This lesson is part of the Virginia K-12 Computer Science Pipeline which is partly funded through a GO Virginia grant in partnership with Chesapeake Public Schools, Loudoun County Public Schools, and the Loudoun Education Foundation. During the lesson, students will investigate the relationships between natural, human, and capital resources.
Data and PredictionsComputer Science Strand: Data and AnalysisData can be useful to …
Data and PredictionsComputer Science Strand: Data and AnalysisData can be useful to make predictions from trends in the data. A trend in the data is the general direction in which something is developing or changing. Based on the direction the data is going, you can make a prediction as to what may happen next. A prediction is when you use data to make an informed guess as to what may happen in the future.
This gives students two different things to do with what they have …
This gives students two different things to do with what they have learned and read about Storms and precipitation. Not only will students have a good time using stamps but they can also take what they read and interpret it into a graph. This is a very vital skill throughout school all the way up until 12 grade.
This lesson will track the weather for a week. It will get …
This lesson will track the weather for a week. It will get students actively engaged in checking the weather. This will help teach responsibility as a child can prepare how to dress for the weather as well. Students will learn great science vocabulary as well as spark an interest that may lead to further weather investigations.
No restrictions on your remixing, redistributing, or making derivative works. Give credit to the author, as required.
Your remixing, redistributing, or making derivatives works comes with some restrictions, including how it is shared.
Your redistributing comes with some restrictions. Do not remix or make derivative works.
Most restrictive license type. Prohibits most uses, sharing, and any changes.
Copyrighted materials, available under Fair Use and the TEACH Act for US-based educators, or other custom arrangements. Go to the resource provider to see their individual restrictions.