This video lesson is part of a two-part series and introduces the …
This video lesson is part of a two-part series and introduces the concept of temperature. Temperature can be a challenging concept to convey since our perception is tied to words that are relative to our own experience, which varies quite a lot. A short activity to be performed in the classroom shows the need for a temperature scale since qualitative descriptions are not adequate. Temperatures that vary from the hottest to coldest recorded temperatures on earth are shown in advance of introducing the boiling temperatures of a number of cryogenic liquids.
This activity is a investigation where students observe soil and rocks, record …
This activity is a investigation where students observe soil and rocks, record their similarities and differences, interpret their findings, and are guided to develop a new investigable question.
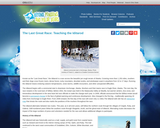
This article gives background information on the Iditarod race in Alaska and …
This article gives background information on the Iditarod race in Alaska and shows how the race can be used in Grades K-5 classrooms to incorporate science, geography and language arts. The author provides links to resources that involve reading expository tests and writing assignments as well as working with real-time data. The article appears in the free, online magazine Beyond Penguins and Polar Bears.
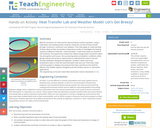
With the assistance of a few teacher demonstrations (online animation, using a …
With the assistance of a few teacher demonstrations (online animation, using a radiometer and rubbing hands), students review the concept of heat transfer through convection, conduction and radiation. Then they apply an understanding of these ideas as they use wireless temperature probes to investigate the heating capacity of different materials sand and water under heat lamps (or outside in full sunshine). The experiment models how radiant energy drives convection within the atmosphere and oceans, thus producing winds and weather conditions, while giving students the hands-on opportunity to understand the value of remote-sensing capabilities designed by engineers. Students collect and record temperature data on how fast sand and water heat and cool. Then they create multi-line graphs to display and compare their data, and discuss the need for efficient and reliable engineer-designed tools like wireless sensors in real-world applications.
A realistic mass and spring laboratory. Hang masses from springs and adjust …
A realistic mass and spring laboratory. Hang masses from springs and adjust the spring stiffness and damping. You can even slow time. Transport the lab to different planets. A chart shows the kinetic, potential, and thermal energy for each spring.
In this group task students collect data and analyze from the class …
In this group task students collect data and analyze from the class to answer the question "is there an association between whether a student plays a sport and whether he or she plays a musical instrument? "
Vision is the primary sense of many animals and much is known …
Vision is the primary sense of many animals and much is known about how vision is processed in the mammalian nervous system. One distinct property of the primary visual cortex is a highly organized pattern of sensitivity to location and orientation of objects in the visual field. But how did we learn this? An important tool is the ability to design experiments to map out the structure and response of a system such as vision. In this activity, students learn about the visual system and then conduct a model experiment to map the visual field response of a Panoptes robot. (In Greek mythology, Argus Panoptes was the "all-seeing" watchman giant with 100 eyes.) A simple activity modification enables a true black box experiment, in which students do not directly observe how the visual system is configured, and must match the input to the output in order to reconstruct the unseen system inside the box.
Students apply concepts of disease transmission to analyze infection data, either provided …
Students apply concepts of disease transmission to analyze infection data, either provided or created using Bluetooth-enabled Android devices. This data collection may include several cases, such as small static groups (representing historically rural areas), several roaming students (representing world-travelers), or one large, tightly knit group (representing urban populations). To explore the algorithms to a deeper degree, students may also design their own diseases using the App Inventor framework.
Students will raise questions about the natural world and seek answers by …
Students will raise questions about the natural world and seek answers by making careful observations about the weather. Students will measure, record and describe weather conditions using common tools, like thermometer, anemometer, rain gauge and possibly, light meter.
In this activity, learners work in groups to determine the mass and …
In this activity, learners work in groups to determine the mass and volume of four samples: glass marbles, steel washers or nuts, pieces of pine wood, and pieces of PVC pipe. Learners then plot the data points on a large class graph of mass vs. volume to discover that data points for a particular material form a straight line, the slope of which gives the density of the material.
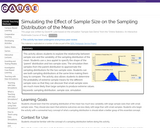
This activity uses simulation to help students understand sampling variability and reason …
This activity uses simulation to help students understand sampling variability and reason about whether a particular samples result is unusual, given a particular hypothesis. By using first candies, then a web applet, and varying sample size, students learn that larger samples give more stable and better estimates of a population parameter and develop an appreciation for factors affecting sampling variability.
Add different salts to water, then watch them dissolve and achieve a …
Add different salts to water, then watch them dissolve and achieve a dynamic equilibrium with solid precipitate. Compare the number of ions in solution for highly soluble NaCl to other slightly soluble salts. Relate the charges on ions to the number of ions in the formula of a salt. Calculate Ksp values.
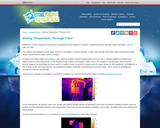
This article describes the basics of thermography or thermal imaging, and how …
This article describes the basics of thermography or thermal imaging, and how this technique can inspire a data collection activity to teach about heat transfer and energy efficiency.
Students modify a provided App Inventor code to design their own diseases. …
Students modify a provided App Inventor code to design their own diseases. This serves as the evolution step in the software/systems design process. The activity is essentially a mini design cycle in which students are challenged to design a solution to the modification, implement and test it using different population patterns The result of this process is an evolution of the original app.
Students participating in Storm Signals play a critical role in the overall …
Students participating in Storm Signals play a critical role in the overall process of the Student Observation Network (S.O.N.). They are able to confirm the predictions of the Sunspotter's Sunspot Suspect, and they will predict magnetic storms around Earth, issuing Space Weather alerts that tell other students to begin monitoring the Magnetosphere for magnetic storms. By collecting and analyzing real-time data from their radio antennas, professional observatories, and NASA satellites, they can carry out the same duties as NASA researchers! The Space Weather alerts issued by the Space Environment Center (SEC) of NOAA (National Oceanographic and Atmospheric Administration) are essential to protect satellites, power grids and astronauts.
In Storm Signals you will learn:
1. How to instruct students in the construction of a simple device to detect radio emissions from the Sun.
2. How to enable students to obtain and interpret radio emissions from ground-based professional observatories.
3. How to enable students to obtain and interpret radio, x-ray and ultraviolet emissions from NASA satellites.
This article provides ideas, lessons and resources on how elementary teachers can …
This article provides ideas, lessons and resources on how elementary teachers can integrate map skills, math, and art into lessons about the geography of the Arctic and Antarctica.
In this classroom project, students and faculty help a local housing non-profit …
In this classroom project, students and faculty help a local housing non-profit identify area U.S. Census tracts most in need of its assistance in promoting decent and affordable homeownership to low- to moderate- income individuals. While this example describes an experience in a small, upper-level elective economics course, it includes suggestions for modifications of design and learning goals for other learning levels and environments.
Using quadrats along line transects in two different habitats, students will gather …
Using quadrats along line transects in two different habitats, students will gather data which will provide evidence that shows the interrelationships between vegetation types and small mammal populations
No restrictions on your remixing, redistributing, or making derivative works. Give credit to the author, as required.
Your remixing, redistributing, or making derivatives works comes with some restrictions, including how it is shared.
Your redistributing comes with some restrictions. Do not remix or make derivative works.
Most restrictive license type. Prohibits most uses, sharing, and any changes.
Copyrighted materials, available under Fair Use and the TEACH Act for US-based educators, or other custom arrangements. Go to the resource provider to see their individual restrictions.