This annotated PowerPoint provide support to teachers and leaders interested in learning about the 5E instrucitonal model.
- Subject:
- Science
- Material Type:
- Teaching/Learning Strategy
- Author:
- Anne Petersen
- Date Added:
- 12/21/2020

This annotated PowerPoint provide support to teachers and leaders interested in learning about the 5E instrucitonal model.

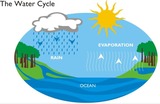
This 5E lesson begins with an Engage activity that assesses prior knowledge of water cycle from elementary school. It is followed by an Explore activity where students observe a teacher demonstrating the water cycle in a bowl and gather information based on their observations. It continues with an Explain where students have the opportunity to explain what they understand on the water cycle with an emphasis of phase changes. In the evaluate stage, students apply their knowledge of solids and liquids to classfiy various forms of precipitation. .

This PDF information sheet covers the 5 types of basic computer networks with review questions.Strand: Networking and the InterentSOL(s): 5.17 The student will compare and contrast the difference between a local network and a worldwide network.

Computer Science Standard Alignment Guides are resources for teachers working to integrate computer science into their core curriculum. These guides explain the standard, give a sample activity or lesson that teaches the standard, and ways to measure student proficiency on the skill or concept.

End-of-year multiple choice math questions which review all of the objectives in fifth-grade math.

The Computer Science Office in Loudoun County Public Schools has developed this curriculum integration document to support the integration of the 2017 Virginia Computer Science Standards into core subject areas and beyond. Each CS standard was aligned to up to 3 grade level standards that made natural correlations.Additionally, many activities and resources were included to each standard to support the introduction and integration of the standard. For each of the six strands of the Computer Science Standards of Learning: Computing Systems, Networks and the Internet, Cybersecurity, Data and Analysis, Algorithms and Programming, and Impacts of Computing, we have included tiered support called "Fuel", "Spark", and "Ignite". The "Fuel" is provided to build teacher capacity and students' understanding in understanding the CS SOL. The "Spark" provides a Computer Science integrated experience into a core or speciality subject SOL. The "Ignite" section is where teachers in Loudoun County have the opportunity to share authentic learning experiences and lessons in our LCPS Computer Science Lesson Repository.This document was created as part of the Virginia K-12 Computer Science Pipeline which is partly funded through a GOVA and DHCD grant in partnership with Chesapeake Public Schools, Loudoun County Public Schools, and the Loudoun Education Foundation.

Analyzing Graphs Algebra Readiness Remediation Plan

Circle Graph Pieces Algebra Readiness Remediation Plan

Circle Graphs Algebra Readiness Remediation Plan

Data Organizers Algebra Readiness Remediation Plan

May I Have Fries With That? Mathematics Instructional Plan

Screen Time Task Template, Student Version of Task, Anchor Pages and Scoring Rationale

Balancing Act Mathematics Instructional Plan

Effects on Measures of Center Mathematics Instructional Plan

Proportional Relationships Algebra Readiness Remediation Plan

Ratio Tables and Unit Rates Algebra Readiness Remediation Plan

The opening slide describes that the best deal is getting more for your money. Things on sale are not always at the best price and the amount of product matters. Students are given five slides with two or three prices. Students have to determine which is a better deal. Students may use unit rates, but students are also asked to use another way to determine which is a better deal. Students can scale up or down using ratio tables or by purchasing the same quantity of each item.

This lesson should be used as practice after students have had experience with ratio tables, graphing points, and determining proportional relationships. On slides 1-4 students are given a situation, then they complete the ratio table, graph the coordinates, and determine if the relationship is proportional. On slides 5-7 students are given graphs and asked to determine if it represents proportional relationships, and explain why. On slide 8 students are given written situations and asked to determine if they represent proportional relationships and explain their reasoning. This lesson was created with Jamboard to provide teachers and students with real time collaboration.

Proportional Relationship Algebra Readiness Formative Assessment

Ratio Tables and Unit Rates Mathematics Instructional Plan