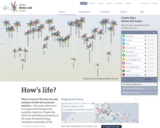
Interactive resource codes either "OECD large regions" usually the primary subnational administrative …
Interactive resource codes either "OECD large regions" usually the primary subnational administrative unit of an OECD country -- (eg. states) or "OECD small regions" usually the secondary subnmational administrative unit -- (eg. counties) by demographic, economic and educational statistics. Regions are compared on a color coded map (for any single variable), scatter plot (for any two variables, table lens or data grid (for a large number of variables. Allows transnational comparisons across all rich countries, but also allows the specificity of focusing on subnational -- and sometimes very small -- geographic units.
During the 1840s tens of thousands of American migrants made long journeys …
During the 1840s tens of thousands of American migrants made long journeys through the American West seeking land in Oregon, gold in California, and religious liberty in Utah.
In this project, You will compare homemade applesauce and store bought applesauce. …
In this project, You will compare homemade applesauce and store bought applesauce. We’ll look at the cost, nutritional information and taste of each option. You’ll make your own applesauce, test different brands, and then use simple programming to analyze and visualize the data. By the end you will be able to decide which option is healthier, more affordable and tastier!
Students will experiment by comparing the leg and arm lengths of the …
Students will experiment by comparing the leg and arm lengths of the students in the class. They will create a Google Form and use it to record the data that they collect. They will use the spreadsheet created by the form to analyze the data and create charts and graphs. Students will then draw conclusions and make predictions based on their data.
Collecting, analyzing, and graphing data with Paper Airplanes. This lesson is designed …
Collecting, analyzing, and graphing data with Paper Airplanes. This lesson is designed to use student-created paper airplanes to test a hypothesis, make predictions, and use the data to create and compare results in various graphs and charts.
This engaging lesson offers students multiple opportunities to collect data and create …
This engaging lesson offers students multiple opportunities to collect data and create their own charts and graphs as they rotate through fun and exciting stations that incorporate computer science, math, science, and visual art.
Students will dive into the different components of computing systems, as we …
Students will dive into the different components of computing systems, as we collect data from our homes to find out what computing systems are most commonly used in our families. Students will practice identifying inputs and output computer systems.
This lesson will track the weather for a week. It will get …
This lesson will track the weather for a week. It will get students actively engaged in checking the weather. This will help teach responsibility as a child can prepare how to dress for the weather as well. Students will learn great science vocabulary as well as spark an interest that may lead to further weather investigations.
Are you looking for a new activity to do with types of …
Are you looking for a new activity to do with types of conflict? Do you want to encourage your students to understand the importance of knowing the why behind the need for multiple times practicing a skill? Why not incorporate analyzing data into identifying the types of conflict being used in a story?
Map shows census divisions (a variably sized region ranging from 1100 and …
Map shows census divisions (a variably sized region ranging from 1100 and 2.5 million people) color coded by the percentage of people living in the area that lived in a different province or territory five years ago. CDs in sparsely populated regions are excluded. The map suggests that there is a great deal of migration into Alberta -- likely to work in the oil industry.
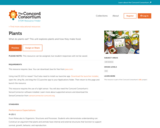
Many factors influence the success and survival rate of a population of …
Many factors influence the success and survival rate of a population of living things. Explore several factors that can determine the survival of a population of sheep in this NetLogo model. Start with a model of unlimited grass available to the sheep and watch what happens to the sheep population! Next try to keep the population under control by removing sheep periodically. Change the birthrate, grass regrowth rate, and the amount of energy rabbits get from the grass to keep a stable population.
The population projections presented in this publication cover the period 30 June …
The population projections presented in this publication cover the period 30 June 2008 to 2101 for Australia and 30 June 2008 to 2056 for the states, territories, and capital cities/balances of state.
This issue contains estimates of the resident population of Australian states and …
This issue contains estimates of the resident population of Australian states and territories as at 30 June of each reference year. Estimates up to 2006 are final, based on the results of the 2006 Census of Population and Housing. Estimates for June 2007 have been revised and estimates from June 2008 onwards are preliminary.
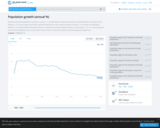
Data set and map pertaining to population growth for all countries as …
Data set and map pertaining to population growth for all countries as an annual percentage. The World Bank specifies population growth as a World Development Indicator (WDI) -- the statistical benchmark that helps measure the progress of development.
Simplified datasets for SPSS covering public opinion on social issues. The same …
Simplified datasets for SPSS covering public opinion on social issues. The same questions were repeated over the course of several surveys from 1974 to 2004. Students can work with data both over time and for a single survey. Teaches students data analysis skills as well as about changes in beliefs over the past thirty years.
Delve into a microscopic world working with models that show how electron …
Delve into a microscopic world working with models that show how electron waves can tunnel through certain types of barriers. Learn about the novel devices and apparatuses that have been invented using this concept. Discover how tunneling makes it possible for computers to run faster and for scientists to look more deeply into the microscopic world.
No restrictions on your remixing, redistributing, or making derivative works. Give credit to the author, as required.
Your remixing, redistributing, or making derivatives works comes with some restrictions, including how it is shared.
Your redistributing comes with some restrictions. Do not remix or make derivative works.
Most restrictive license type. Prohibits most uses, sharing, and any changes.
Copyrighted materials, available under Fair Use and the TEACH Act for US-based educators, or other custom arrangements. Go to the resource provider to see their individual restrictions.