This Edpuzzle assignment uses a clip from the YouTube video "Binary Numbers for …
This Edpuzzle assignment uses a clip from the YouTube video "Binary Numbers for Kids" by Socratica Kids to ask questions for understanding about binary numbers.
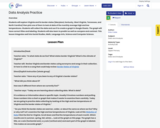
This is a lesson plan where students will collect data using a …
This is a lesson plan where students will collect data using a survey, record their findings using a pictograph, and make predictions about their findings. This is from the essential knowledge of the Comptuer Science standard 2.11.
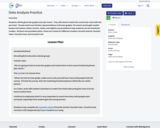
This is a lesson plan designed for instructors in which students conduct …
This is a lesson plan designed for instructors in which students conduct research on the town they live in, share their findings on Google Jamboard with their classmates, and organize their findings into a chart on Google Sheets in order to make predictions about the data.
This is a lesson plan based on the Computer Science standard, 2.12, …
This is a lesson plan based on the Computer Science standard, 2.12, where students will create a model. The students will visit a website first to see how a digital model looks and then will create their own digital models of the solar system by using Google Jamboard.
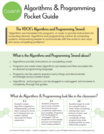
These Pocket Guides are a quick summary of each of the 6 …
These Pocket Guides are a quick summary of each of the 6 computer science strands for grades K-8. The pocket guides explain what the strand is about and how it increases in complexity from Kindergarten to 8th grade.
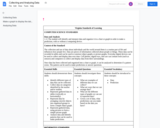
Introducing Data collection and Analysis: This activity include a data collection sheet …
Introducing Data collection and Analysis: This activity include a data collection sheet and questions to analyze the data. The activity can be done as a whole group, small group, or by individual students. Estimated time from start to finish is 30-45 minutes based on prior knowledge.
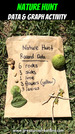
In this lesson students will collect items in nature. They will then …
In this lesson students will collect items in nature. They will then count, graph, and analyze the data they collected. The lesson is set up to use a bar graph, but any graph can be used.
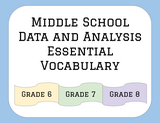
In presentation mode, teachers and students can review the interactive Data and …
In presentation mode, teachers and students can review the interactive Data and Analysis Vocabulary terms Slideshow based on the 2017 CS Curriculum Frame Work glossary of terms for grade 6.Additionally, a quick quiz has been included (Google Forms) for a class assignment or assessment purposes.
In presentation mode, teachers and students can review the interactive Data and …
In presentation mode, teachers and students can review the interactive Data and Analysis Vocabulary terms Slideshow based on the 2017 CS Curriculum Framework lessons for grade 8. Additionally, a quick quiz has been included (Google Forms) for a class assignment or for assessment purposes.
Students will explore Virginia and its border states (Maryland, Kentucky, West Virginia, …
Students will explore Virginia and its border states (Maryland, Kentucky, West Virginia, Tennessee, and North Carolina) then pick one of them to look at data of the monthly average high and low temperatures. Students will collect the data and use it to create a graph in Google Sheets. The graph will have correct titles and labeling. Students will also learn to predict as well as compare and contrast. This lesson integrates well into Social Studies, Math, Language Arts, Science and Computer Science.
Students will be given bar graphs and pie charts. They will need …
Students will be given bar graphs and pie charts. They will need to match the correct bar chart with the pie chart. The pie charts are fraction representations of the bar graphs. Pie charts and length models broken into halves, thirds, fourths, sixths, and eighths are provided to help students see the fractional models. All items are provided online. There are a total of 4 different models: Favorite Animal, Favorite Color, Favorite Food, and Favorite Fruit
The student will use previously collected personal and peer data (Part 1: …
The student will use previously collected personal and peer data (Part 1: Screen Time Logs) to graph a bar and pie graph in Slides using Sheets to graph the data collected.This is the second part of an intended presentation project for a computer CTE middle school class, but can be edited and adapted for any graphing and/or computer integration lessons about bar and pie graphs and how to make them in Google Sheets using Google Slides.
This lesson sequence offers students and teachers a way to develop data …
This lesson sequence offers students and teachers a way to develop data science skills using the CODAP “low-code” data analysis tool. View the materials on Google Drive or PDF. This material was created by Sara Fergus, Christa VanOlst, & Jon Stapleton for CodeVA with support from Capital One.
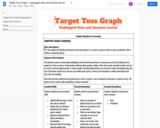
Target Toss Graphing is a fun way for students to begin graphing …
Target Toss Graphing is a fun way for students to begin graphing and data analysis. In this lesson, students will work in either a small group, math rotation station, partners, or individually to collect, graph, and analyze data. The students will toss a pom pom towards a printed target board, document their results, and create a bar graph based on their data. Once they complete the graph, they can answer the provided questions to test their understanding. Have fun collecting and graphing your data!
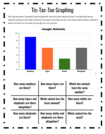
This 4 pack of Tic-Tac-Toe Graphing Games is great for a math …
This 4 pack of Tic-Tac-Toe Graphing Games is great for a math station or small group activity. The students answer tic-tac-toe questions by analyzing the given graphs. If they get the question correct, they place their marker on the board . If they answer incorrectly, it moves on to their partners turn. The first person to 3 in a row wins. If no one gets 3 in a row, they play again.
The questions are very basic for beginning data analysis. The teacher can make a copy of the google doc and change the questions based on the classroom needs.
This is a writing prompt choice board intended to be used in …
This is a writing prompt choice board intended to be used in a writing center or station. In my classroom we typically use one choice board per week. Students choose up to 4 items to complete for the week. I do 4 items to give students time to finish incomplete work on Fridays, to work on final drafts, to edit a selected item, or to share their writing with peers. You can make the rules for your classroom to best suit your teaching style and your student's needs.
The choice board includes 8 prompts and one Student Choice square based on Data and Analysis standards for first grade.
Please feel free to make a copy of the choice board and edit it to meet your specifications.
No restrictions on your remixing, redistributing, or making derivative works. Give credit to the author, as required.
Your remixing, redistributing, or making derivatives works comes with some restrictions, including how it is shared.
Your redistributing comes with some restrictions. Do not remix or make derivative works.
Most restrictive license type. Prohibits most uses, sharing, and any changes.
Copyrighted materials, available under Fair Use and the TEACH Act for US-based educators, or other custom arrangements. Go to the resource provider to see their individual restrictions.