
Collect, Organize, and Represent Data Formative Assessment - Just in Time Quick Check, Teacher Notes, and Supporting Resources
- Subject:
- Mathematics
- Material Type:
- Assessment
- Provider:
- VDOE
- Author:
- VDOE
- Date Added:
- 10/03/2024

Collect, Organize, and Represent Data Formative Assessment - Just in Time Quick Check, Teacher Notes, and Supporting Resources

Investigating forms of data collection - Mathematics Instructional Plan

Read and Interpret Data Formative Assessment - Just in Time Quick Check, Teacher Notes, and Supporting Resources

Classifying concrete object according to attributes - Mathematics Instructional Plan

Sort and Classify Objects Formative Assessment - Just in Time Quick Check, Teacher Notes, and Supporting Resources

This video is part of the Learn and Grow with WHRO TV series. Watch Carolyn Harris teach about sorting shapes according to one or two attributes.

Students will categorize attribute blocks based on their color, thickness and/or size. Optionally, connections to categorizing will be related to robots (e.g. looks, motions, sounds) and coding.

ClassifyingMathematics Instructional Plans (MIPs) help teachers align instruction with the 2016 Mathematics Standards of Learning (SOL) by providing examples of how the knowledge, skills and processes found in the SOL and curriculum framework can be presented to students in the classroom.
Students will play the Game “Cheese Chase” where they learn about moving horizontally and vertically on a grid, which will be followed up by a variety of 40 gameboards where the students learn about naming cells in a spreadsheet. There are five activities where the students make bar graphs after interpreting data from a spreadsheet.
Introducing Data collection and Analysis:
This activity include a data collection sheet and questions to analyze the data.
The activity can be done as a whole group, small group, or by individual students.
Estimated time from start to finish is 30-45 minutes based on prior knowledge.

In this lesson students will collect items in nature. They will then count, graph, and analyze the data they collected. The lesson is set up to use a bar graph, but any graph can be used.

The lessons included in the attached Google Slides incorporate standards from Computer Science, Math, Language Arts, and Physical Education. The lessons all focus on conditional statements (IF, THEN, ELSE) and can easily be adapted to fit any grade from kindergarten to fifth grade.

Investigating forms of data collectionMathematics Instructional Plans (MIPs) help teachers align instruction with the 2016 Mathematics Standards of Learning (SOL) by providing examples of how the knowledge, skills and processes found in the SOL and curriculum framework can be presented to students in the classroom.

This Science lesson covers Science SOL 1.1 i and reviews Math SOL 1.12. In this lesson the students will identify the color of their eyes and use this information to make a pictograph. The class will make a class graph with the option of students then creating their own graph. The students will then analyze the pictograph and answer questions.

This is an active learning lesson on SOL:1.13 The student will sort and classify concrete objects according to one or two attributes.

After reviewing tips for following instructions, students will use plane figures to create a mystery image using their teacher's algorithm. Unfortunately, the teacher's directions are not very precise. Students will lend a hand by giving detailed feedback to debug and clarify the set of ordered instructions to successfully build a snowman.

1.13 Sorting and Classifying by Attributes Co-Teaching MIP
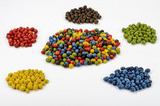
After teaching about sorting objects, students will need some independent practice. In the classroom, students are often able to sort objects physically, but when they are learning online, they may need to do it by a computer program for the sake of teacher assessment. This Google slide deck has three attributes (shape, color, and size) for students to sort the pictures. It also contains some questions about sorting for discussion, whether students are in class or at home.
Target Toss Graphing is a fun way for students to begin graphing and data analysis. In this lesson, students will work in either a small group, math rotation station, partners, or individually to collect, graph, and analyze data. The students will toss a pom pom towards a printed target board, document their results, and create a bar graph based on their data. Once they complete the graph, they can answer the provided questions to test their understanding.
Have fun collecting and graphing your data!
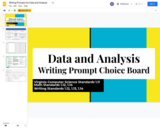
This is a writing prompt choice board intended to be used in a writing center or station. In my classroom we typically use one choice board per week. Students choose up to 4 items to complete for the week. I do 4 items to give students time to finish incomplete work on Fridays, to work on final drafts, to edit a selected item, or to share their writing with peers. You can make the rules for your classroom to best suit your teaching style and your student's needs.
The choice board includes 8 prompts and one Student Choice square based on Data and Analysis standards for first grade.
Please feel free to make a copy of the choice board and edit it to meet your specifications.