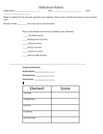
Simple rubric for student created slideshow.
- Subject:
- Data and Analysis
- Material Type:
- Activity/Lab
- Author:
- Christopher McElraft
- Date Added:
- 05/02/2022

Simple rubric for student created slideshow.

Students will be able to explore the different types of soil by planting and monitoring their own plants! Using the soil book, soil kit, and different soil, the students will have hands-on experiences learning about soil. Dive into the different soil types and allow your students access to expand their knowledge using creativity and hands on experiences!
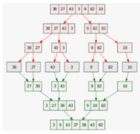
This activity will have students racing to sort numbers or words. They will learn and use both bubble sort and merge sort and see which one is faster/more efficient and which they prefer.
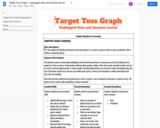
Target Toss Graphing is a fun way for students to begin graphing and data analysis. In this lesson, students will work in either a small group, math rotation station, partners, or individually to collect, graph, and analyze data. The students will toss a pom pom towards a printed target board, document their results, and create a bar graph based on their data. Once they complete the graph, they can answer the provided questions to test their understanding.
Have fun collecting and graphing your data!

Students will simulate the taxes placed on the colonists without having representation and visually represent the loss of wealth for the colonists and the wealth gained by Parliament and the Monarchy by using Google Sheets to create charts.
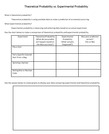
Students Compare Theoretical and Experimental Probability by gathering date, experimenting, and creating a graph.
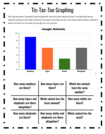
This 4 pack of Tic-Tac-Toe Graphing Games is great for a math station or small group activity. The students answer tic-tac-toe questions by analyzing the given graphs. If they get the question correct, they place their marker on the board . If they answer incorrectly, it moves on to their partners turn. The first person to 3 in a row wins. If no one gets 3 in a row, they play again.
The questions are very basic for beginning data analysis. The teacher can make a copy of the google doc and change the questions based on the classroom needs.

Lesson to support the cross curricular instruction of computer science and mathematics.
Students will learn about treaties and what important role they have played in with Virginia’s Native Americans. They will learn why there are treaties and how they affected the tribes and the Europeans and where they stand in the 21st century. In the second lesson, the teacher will go through the slides with the students explaining what was agreed between the Natives in Virginia and the Europeans that came to their land. This lesson can last as long as it takes to get through the slides, or the teacher can pick some of the agreements and discuss with students.

This lesson introduces 9-12 grade students to the tuple data type using Python. Students will learn what tuples are and how to create and use them.

Students will use Google Forms to organize, analyze, and manipulate data.

The students will utilize Tinkercad to create models about science concepts (e.g. SOL 5.4, 5.5, 5.6, 5.7)

The class will collect data, make a graph (digital and paper), and interpret outcomes to answer questions.

The website, "app.diagrams.net" is an outstanding site for school children to use for creating diagrams such as flowcharts, organizational charts, or sequencing diagrams.In computer science, websites like this are instrumental for artifact planning and creation which is found in multiple grades in the Algorithms and Programming and Data and Analysis strands.
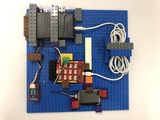
Teachers and students can learn how to put together a Microcontroller Kit with an environmental conditions sensor that measures temperature, humidity, pressure and altitude and could be used for multiple experiments and shared collectively amongst departments or schools.This material is based upon work supported by the National Science Foundation under Grant No. 1657263. Any opinions, findings, and conclusions or recommendations expressed in this material are those of the author(s) and do not necessarily reflect the views of the National Science Foundation.
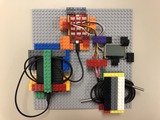
Teachers and students can see an example of how to put together a Microcontroller Kit with a Temperature sensor that could be used for multiple experiments and shared collectively amongst departments or schools.This material is based upon work supported by the National Science Foundation under Grant No. 1657263. Any opinions, findings, and conclusions or recommendations expressed in this material are those of the author(s) and do not necessarily reflect the views of the National Science Foundation.
This activity will ask students to locate geographic regions and features on a class map using longitude and latitude measurements. Using the longitude and latitude data, students will be able to visualize geographic features in the actual location in order to analyze the living conditions of various regions.This material is based upon work supported by the National Science Foundation under Grant No. 2010256.Any opinions, findings, and conclusions or recommendations expressed in this material are those of the author(s) and do not necessarily reflect the views of the National Science Foundation.

In this lesson plans students create a augmented reality (AR) model of the water cycle. They will use an IPad and AR Makr app to create a 3d model to explain this natural occurance. To incorperate Computer Science into this lesson we look at the Data and Analysis section of the Grade 3 Computer Science standards. Specifically CS SOL 3.13, this standard drives many of the questions inside this lesson plan.

Students can read the book independently or you could read as a class. Them students can complete the quiz/assignment independently. I allow students to complete this assignment open book, one question will refer them to a specific page.
Students will apply their knowledge of the characteristics of the five major regions to create if-statements. As a warm-up students will complete a table using IF statements.During student-facing project, students will:Create 2-3 additional variables within the conditions chart that will direct the flow to determine the correct region.Record responses provided by their partner on an excel spreadsheet.Students will use responses provided to draw a conclusion of which region their partner is “located”.